> ## Documentation Index
> Fetch the complete documentation index at: https://docs.dqlabs.ai/llms.txt
> Use this file to discover all available pages before exploring further.
# Alert Detail
> What the alert detail page shows and how to use AI-powered triage, impact analysis, root cause investigation, and alert clusters.
The alert detail page is the primary triage surface. It combines AI-generated context, downstream impact, root cause steps, and cluster information so you can understand why an alert fired and what to do — without navigating away.
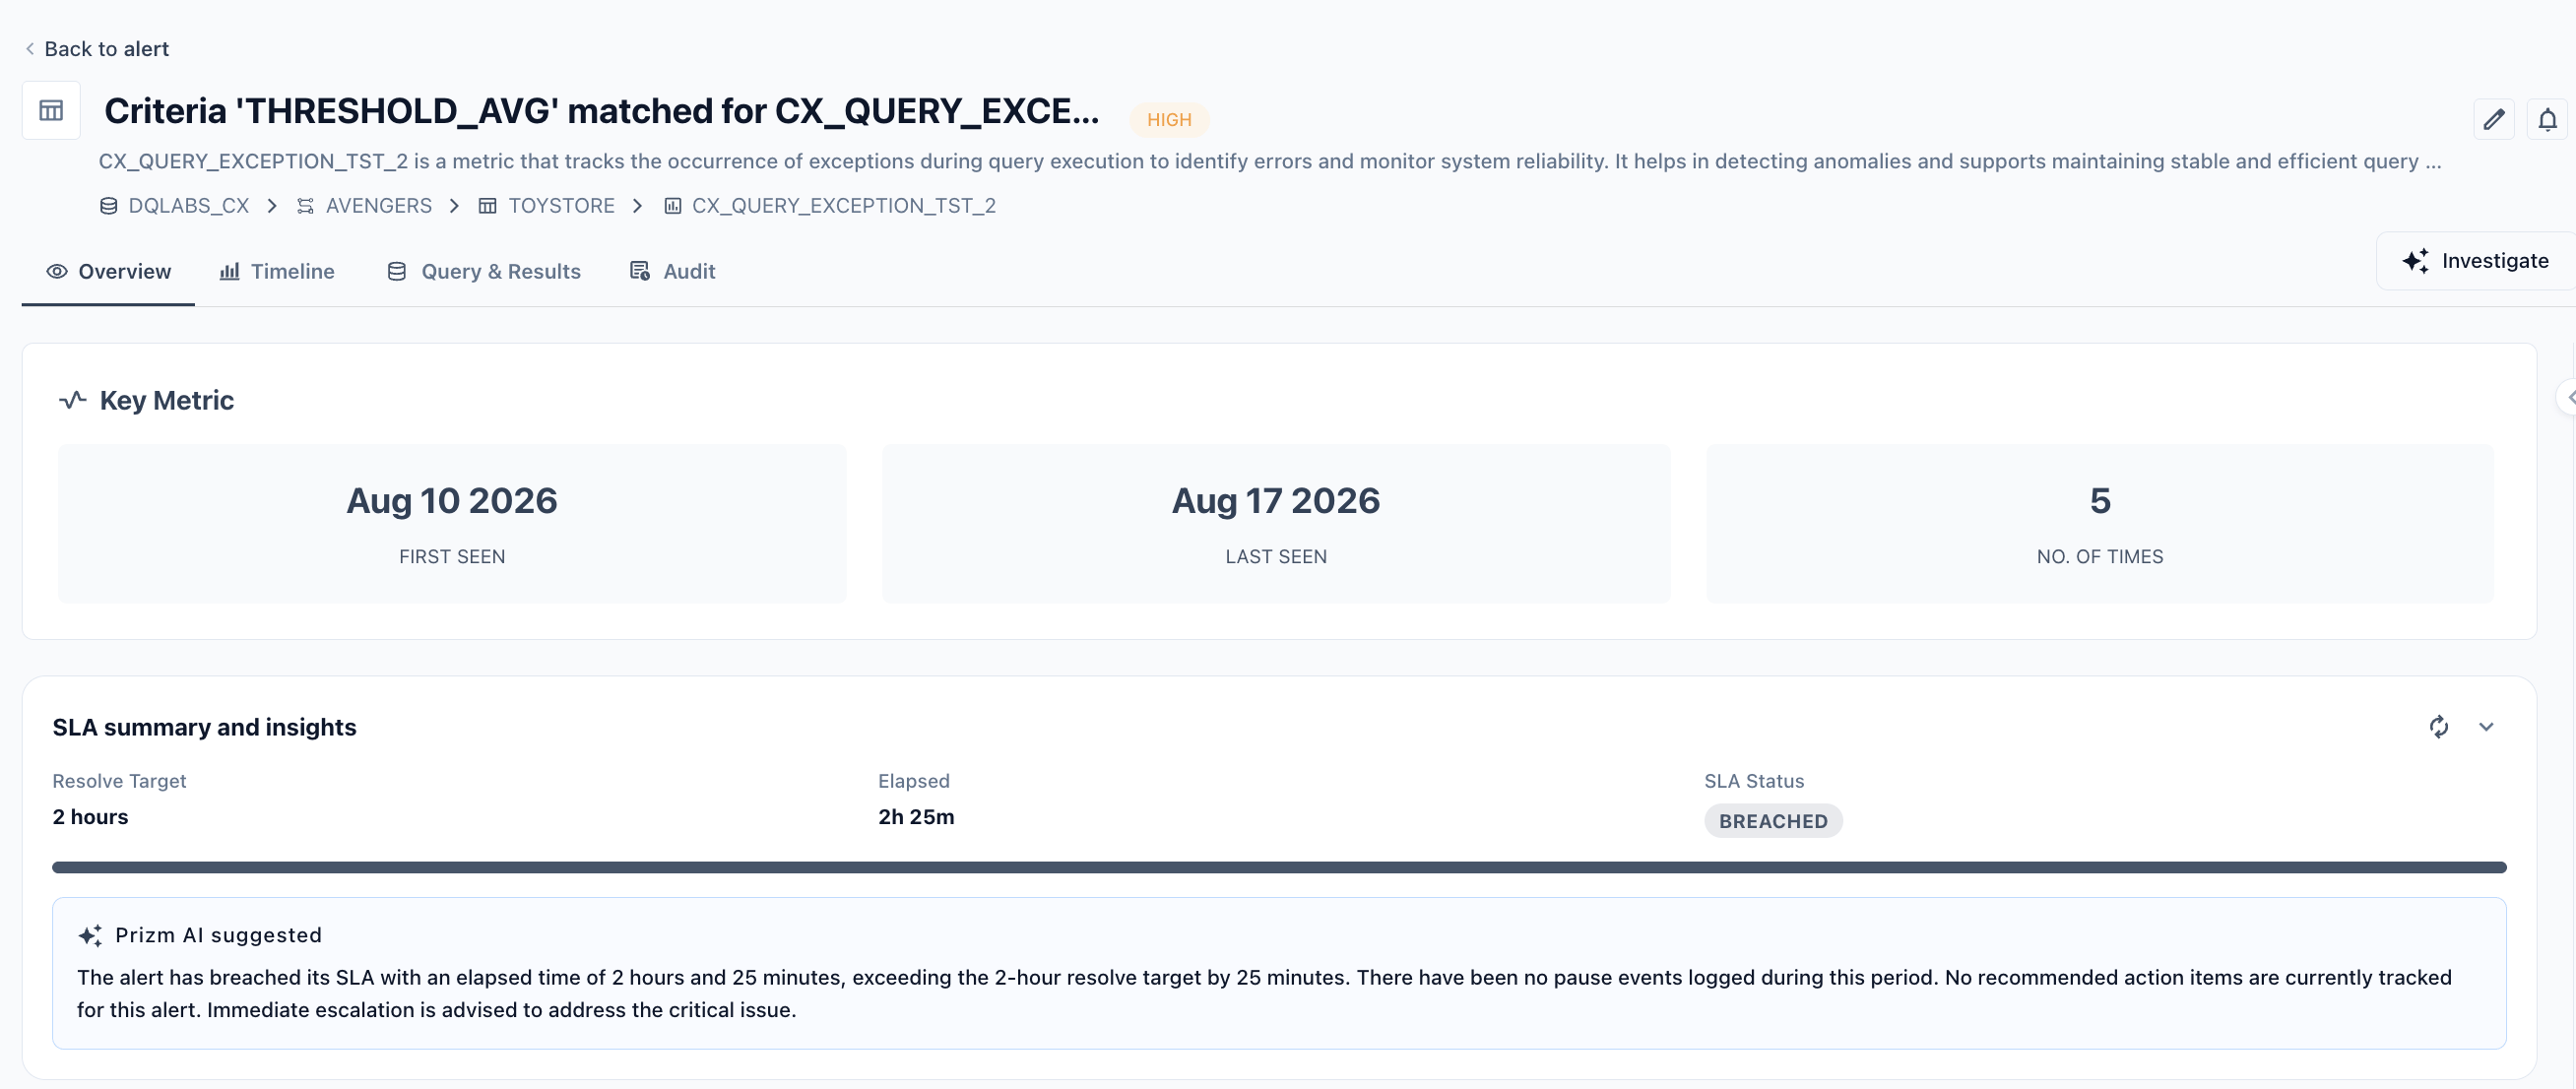 ## Alert header
| Field | Description |
| --------------- | -------------------------------------------------------------------------------------------------------------------------------------- |
| **Alert title** | AI-generated plain-English headline — what happened, which asset or metric, and the magnitude. Replaces raw machine condition strings. |
| **Status** | Current lifecycle state: **Active**, **Mark as Normal**, or **Resolved** |
| **Severity** | Critical, High, Medium, or Low |
| **Fired at** | Timestamp when the threshold was first breached |
| **Duration** | How long the alert has been open |
| **Metric** | The metric that triggered the alert — links to the metric detail page |
| **Asset** | The table, view, or pipeline affected — links to the asset detail page |
### Key metrics
Three quick stats at the top:
| Stat | Description |
| ---------------- | ----------------------------------- |
| **First seen** | When the anomaly was first detected |
| **Last seen** | Most recent occurrence |
| **No. of times** | How many times this alert has fired |
### AI Summary
An AI-generated interpretive paragraph — not a restatement of numbers, but an explanation of what they mean. The summary covers four things in order:
* **What** — the metric, segment, and the observed vs. expected deviation using directional language (spiked, dropped, drifted, exceeded)
* **Pattern** — the anomaly type in plain English: spike (sharp transient rise), drop (sudden decrease), drift (gradual shift), sustained (persistent, not self-correcting), or shift (step-change to a new level)
* **Trend** — improving (may be transient), worsening (prioritise immediately), or stable (not self-correcting)
* **Recurrence** — only shown if the alert has fired more than once; notes how many times since first seen
**Examples of AI-generated titles replacing raw condition strings:**
| Raw machine string | AI-generated title |
| ------------------------------------------------------------------------------------------------------- | ------------------------------------------------------------------------ |
| `BEHAVIORAL_CHECK check failed for segment 426318 for value 21140.000000 deviating 6.62% from baseline` | `Behavioral Metrics 2 — Segment 426318 spiked 6.6% above baseline` |
| `NULL_CHECK failed for value 807, constraint 804` | `DBO_INVDTL.ADDDTE null count exceeded — 807 observed vs. limit 804` |
| `OPENORDERS_ITEM_LOOKUP_MATCH_RATE failed score 91.47 constraint > 90` | `OPENORDERS_ITEM_LOOKUP match rate below target — 91.5% vs. 90% minimum` |
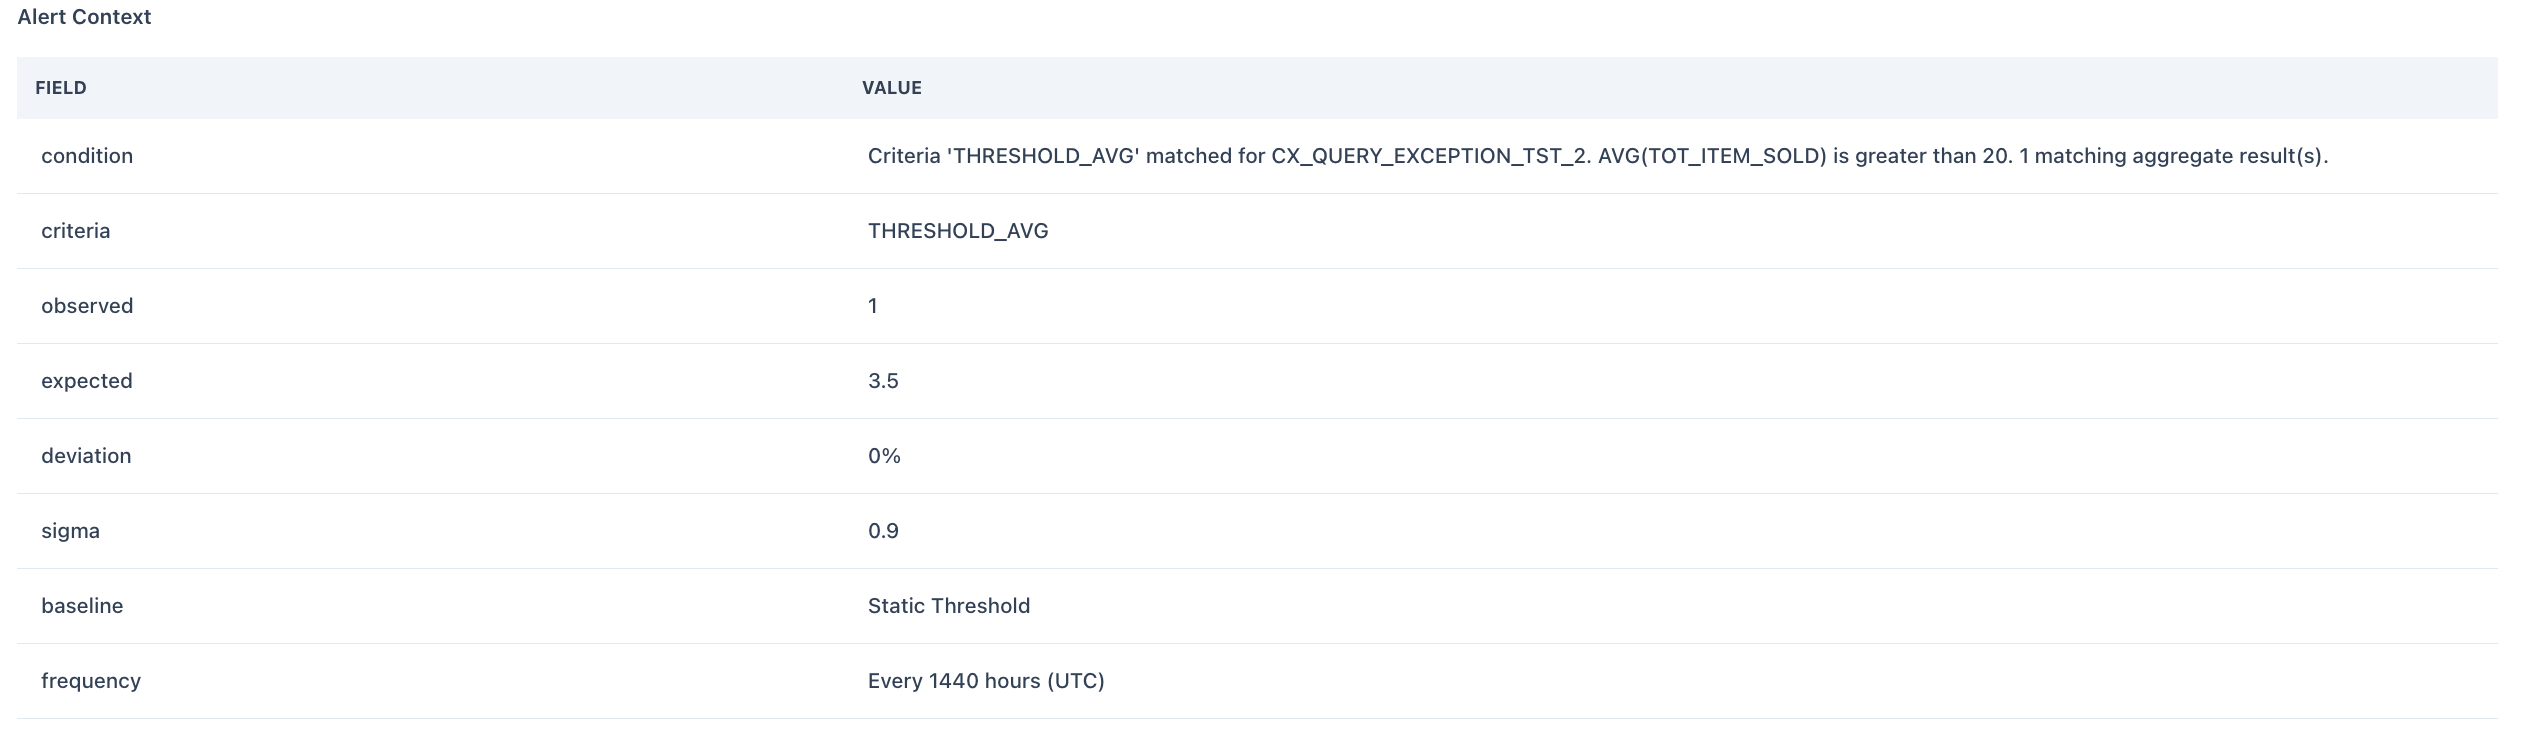
### Alert context
The raw evaluation details behind the alert:
| Field | Description |
| ------------------------ | ---------------------------------------------------------------- |
| **Condition** | The threshold condition that was breached |
| **Observed** | The value returned by the metric run |
| **Expected** | The threshold or baseline value |
| **Deviation** | Absolute and percentage difference |
| **Sigma** | Standard deviations from the baseline (automated threshold only) |
| **Baseline type** | Static threshold or learned statistical model |
| **Evaluation frequency** | How often the metric runs (e.g., conditional, hourly, daily) |
## Alert header
| Field | Description |
| --------------- | -------------------------------------------------------------------------------------------------------------------------------------- |
| **Alert title** | AI-generated plain-English headline — what happened, which asset or metric, and the magnitude. Replaces raw machine condition strings. |
| **Status** | Current lifecycle state: **Active**, **Mark as Normal**, or **Resolved** |
| **Severity** | Critical, High, Medium, or Low |
| **Fired at** | Timestamp when the threshold was first breached |
| **Duration** | How long the alert has been open |
| **Metric** | The metric that triggered the alert — links to the metric detail page |
| **Asset** | The table, view, or pipeline affected — links to the asset detail page |
### Key metrics
Three quick stats at the top:
| Stat | Description |
| ---------------- | ----------------------------------- |
| **First seen** | When the anomaly was first detected |
| **Last seen** | Most recent occurrence |
| **No. of times** | How many times this alert has fired |
### AI Summary
An AI-generated interpretive paragraph — not a restatement of numbers, but an explanation of what they mean. The summary covers four things in order:
* **What** — the metric, segment, and the observed vs. expected deviation using directional language (spiked, dropped, drifted, exceeded)
* **Pattern** — the anomaly type in plain English: spike (sharp transient rise), drop (sudden decrease), drift (gradual shift), sustained (persistent, not self-correcting), or shift (step-change to a new level)
* **Trend** — improving (may be transient), worsening (prioritise immediately), or stable (not self-correcting)
* **Recurrence** — only shown if the alert has fired more than once; notes how many times since first seen
**Examples of AI-generated titles replacing raw condition strings:**
| Raw machine string | AI-generated title |
| ------------------------------------------------------------------------------------------------------- | ------------------------------------------------------------------------ |
| `BEHAVIORAL_CHECK check failed for segment 426318 for value 21140.000000 deviating 6.62% from baseline` | `Behavioral Metrics 2 — Segment 426318 spiked 6.6% above baseline` |
| `NULL_CHECK failed for value 807, constraint 804` | `DBO_INVDTL.ADDDTE null count exceeded — 807 observed vs. limit 804` |
| `OPENORDERS_ITEM_LOOKUP_MATCH_RATE failed score 91.47 constraint > 90` | `OPENORDERS_ITEM_LOOKUP match rate below target — 91.5% vs. 90% minimum` |
### Alert context
The raw evaluation details behind the alert:
| Field | Description |
| ------------------------ | ---------------------------------------------------------------- |
| **Condition** | The threshold condition that was breached |
| **Observed** | The value returned by the metric run |
| **Expected** | The threshold or baseline value |
| **Deviation** | Absolute and percentage difference |
| **Sigma** | Standard deviations from the baseline (automated threshold only) |
| **Baseline type** | Static threshold or learned statistical model |
| **Evaluation frequency** | How often the metric runs (e.g., conditional, hourly, daily) |
 ### Impact Analysis
Shows downstream assets affected (from lineage), plus an **AI Insights** paragraph that translates the blast radius into business language:
* Groups downstream assets by business domain (sales reporting, inventory management, brand performance, etc.)
* Describes which reports, dashboards, or decisions are at risk
* For Critical and High severity, recommends notifying downstream consumers before they run reports from affected assets
### Root Cause Analysis
An **AI Insights** section with two parts:
**Context paragraph** — what the metric measures, how upstream assets feed it, and why the deviation is meaningful given the baseline model.
**Three investigation steps** — numbered, executable, tied to specific upstream assets or transformation layers:
| Step | Focus |
| ------ | --------------------------------------------------- |
| Step 1 | Closest upstream asset — data issues |
| Step 2 | Transformation layer — pipeline or logic issues |
| Step 3 | Prevention — a proactive guard rail for future runs |
Investigation focus by anomaly type:
| Anomaly type | What to look for |
| ------------- | ----------------------------------------------------------------------------------- |
| **Spike** | Duplicate inserts, late-arriving records, joins that fan out, backdated ingestion |
| **Drop** | Missing partitions, failed upstream jobs, filter changes excluding valid records |
| **Drift** | Slow schema changes, accumulating transformation bugs, gradual source system shifts |
| **Sustained** | Unreverted code change or permanent shift in source data definition |
| **Shift** | Deployment, migration, or business rule change that altered the metric definition |
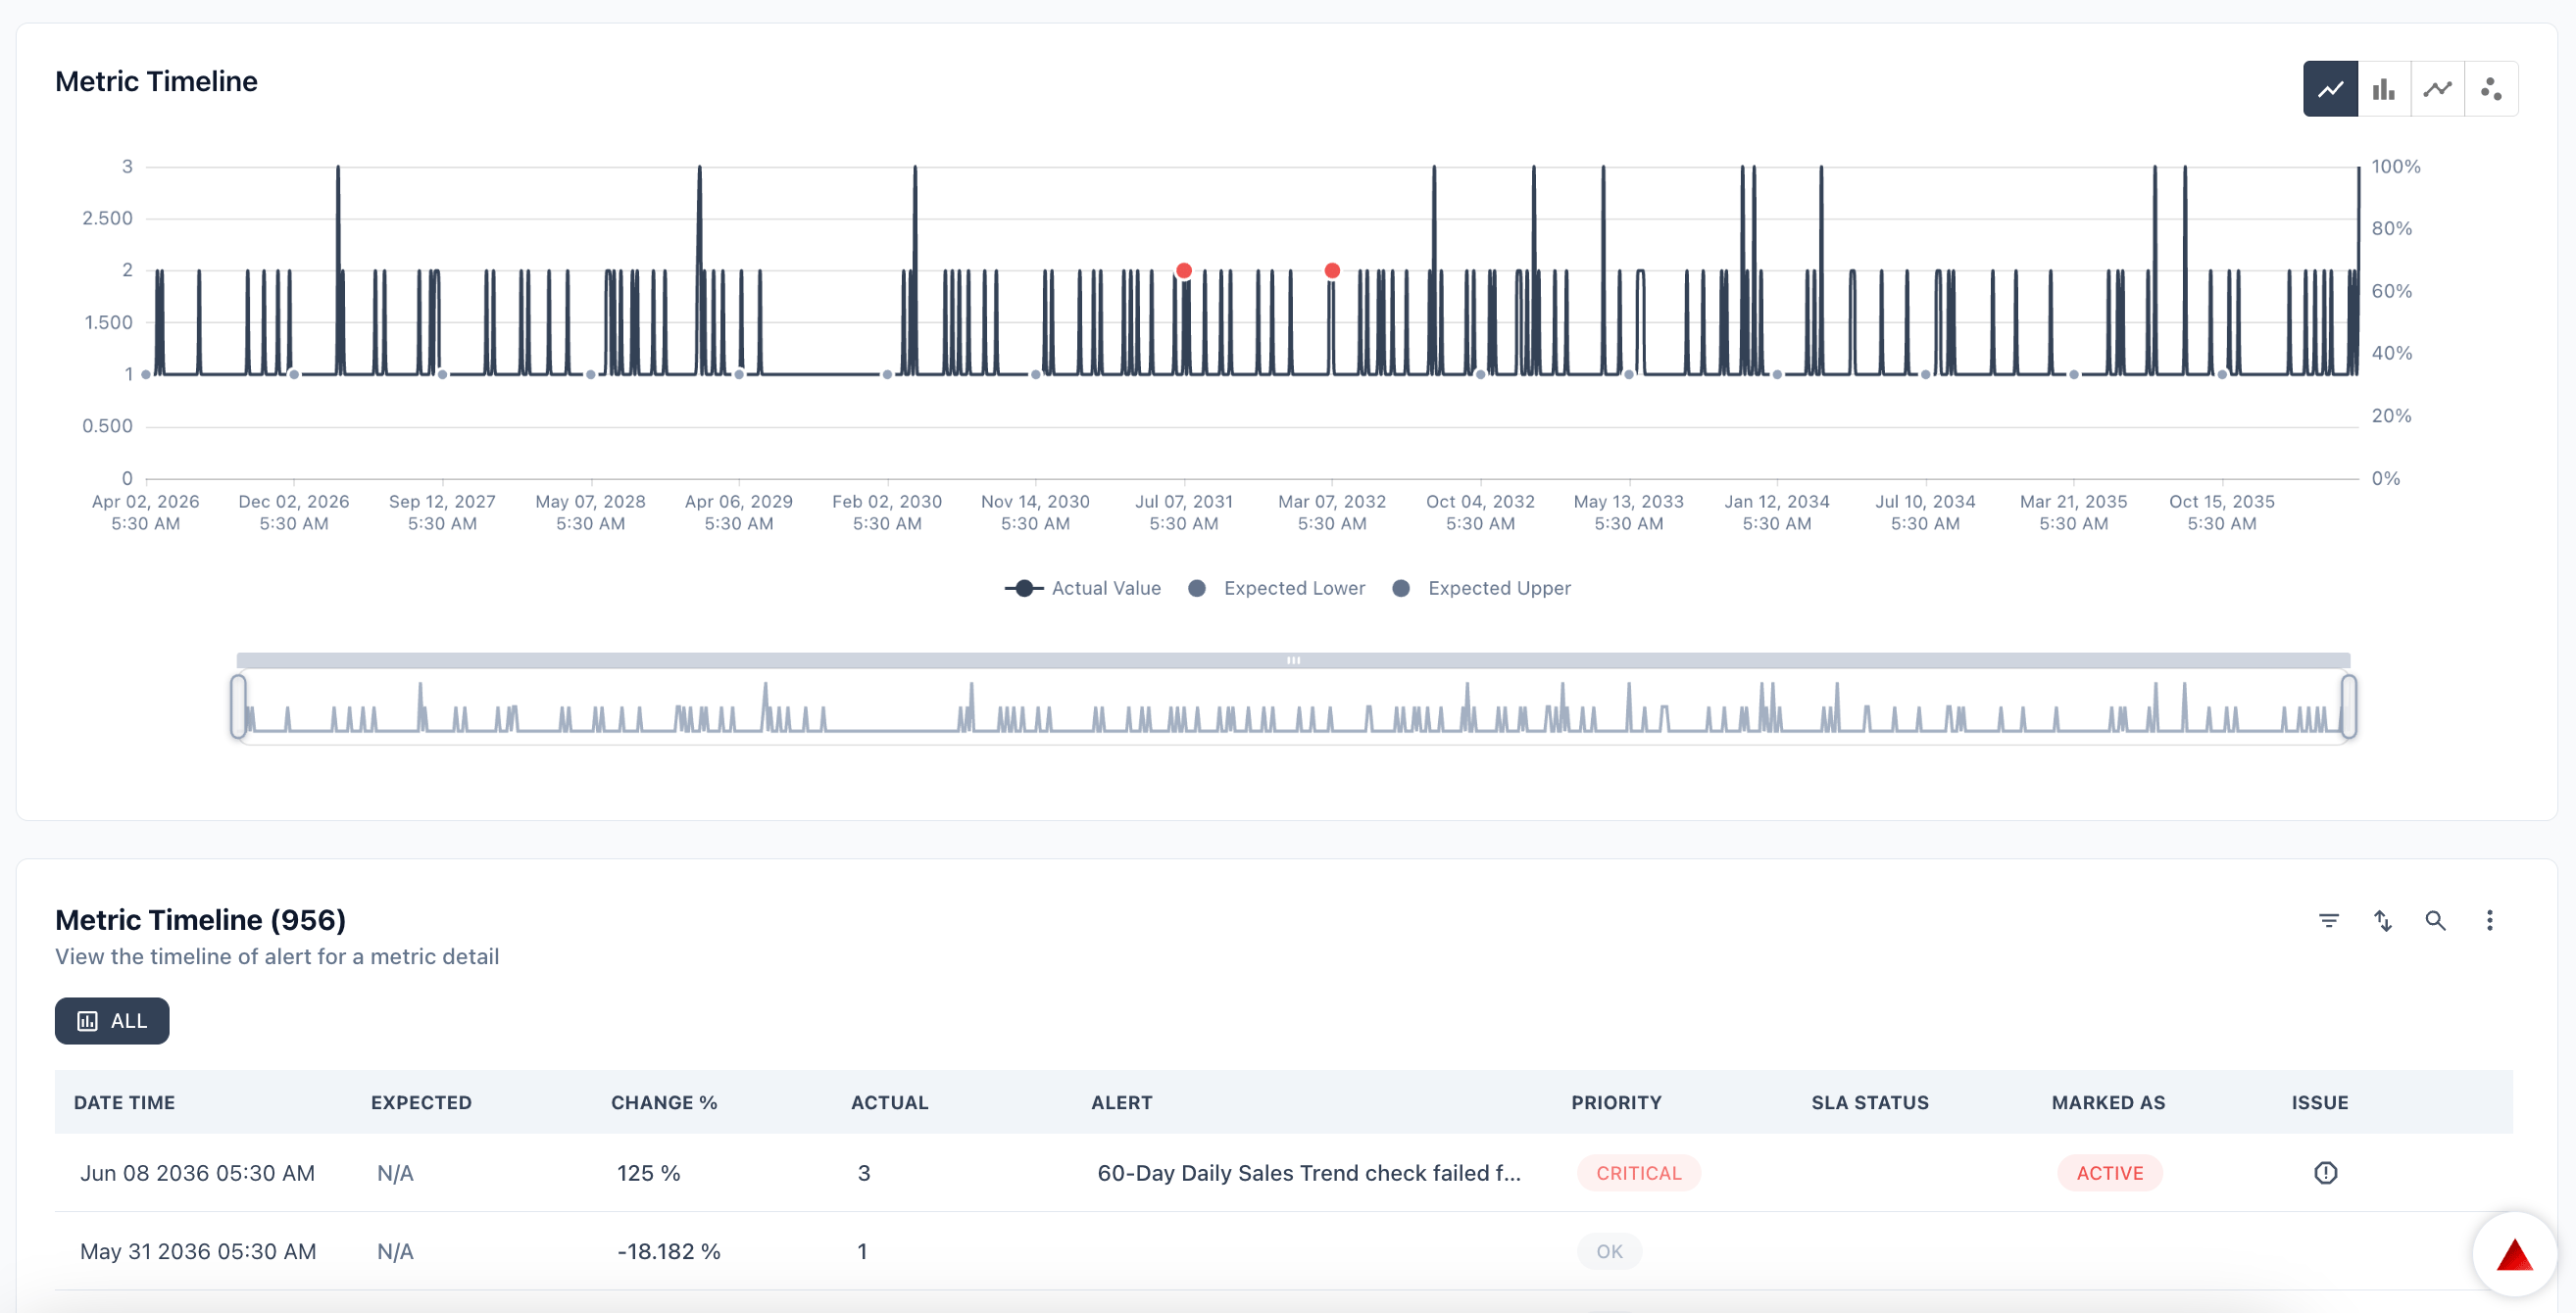
A time-series chart of the metric's actual value over time with breach points marked. The table below shows every occurrence — including runs that passed (`OK`) and runs where notifications were muted.
Click any alert point on the timeline to open its detail directly.
### Impact Analysis
Shows downstream assets affected (from lineage), plus an **AI Insights** paragraph that translates the blast radius into business language:
* Groups downstream assets by business domain (sales reporting, inventory management, brand performance, etc.)
* Describes which reports, dashboards, or decisions are at risk
* For Critical and High severity, recommends notifying downstream consumers before they run reports from affected assets
### Root Cause Analysis
An **AI Insights** section with two parts:
**Context paragraph** — what the metric measures, how upstream assets feed it, and why the deviation is meaningful given the baseline model.
**Three investigation steps** — numbered, executable, tied to specific upstream assets or transformation layers:
| Step | Focus |
| ------ | --------------------------------------------------- |
| Step 1 | Closest upstream asset — data issues |
| Step 2 | Transformation layer — pipeline or logic issues |
| Step 3 | Prevention — a proactive guard rail for future runs |
Investigation focus by anomaly type:
| Anomaly type | What to look for |
| ------------- | ----------------------------------------------------------------------------------- |
| **Spike** | Duplicate inserts, late-arriving records, joins that fan out, backdated ingestion |
| **Drop** | Missing partitions, failed upstream jobs, filter changes excluding valid records |
| **Drift** | Slow schema changes, accumulating transformation bugs, gradual source system shifts |
| **Sustained** | Unreverted code change or permanent shift in source data definition |
| **Shift** | Deployment, migration, or business rule change that altered the metric definition |
A time-series chart of the metric's actual value over time with breach points marked. The table below shows every occurrence — including runs that passed (`OK`) and runs where notifications were muted.
Click any alert point on the timeline to open its detail directly.
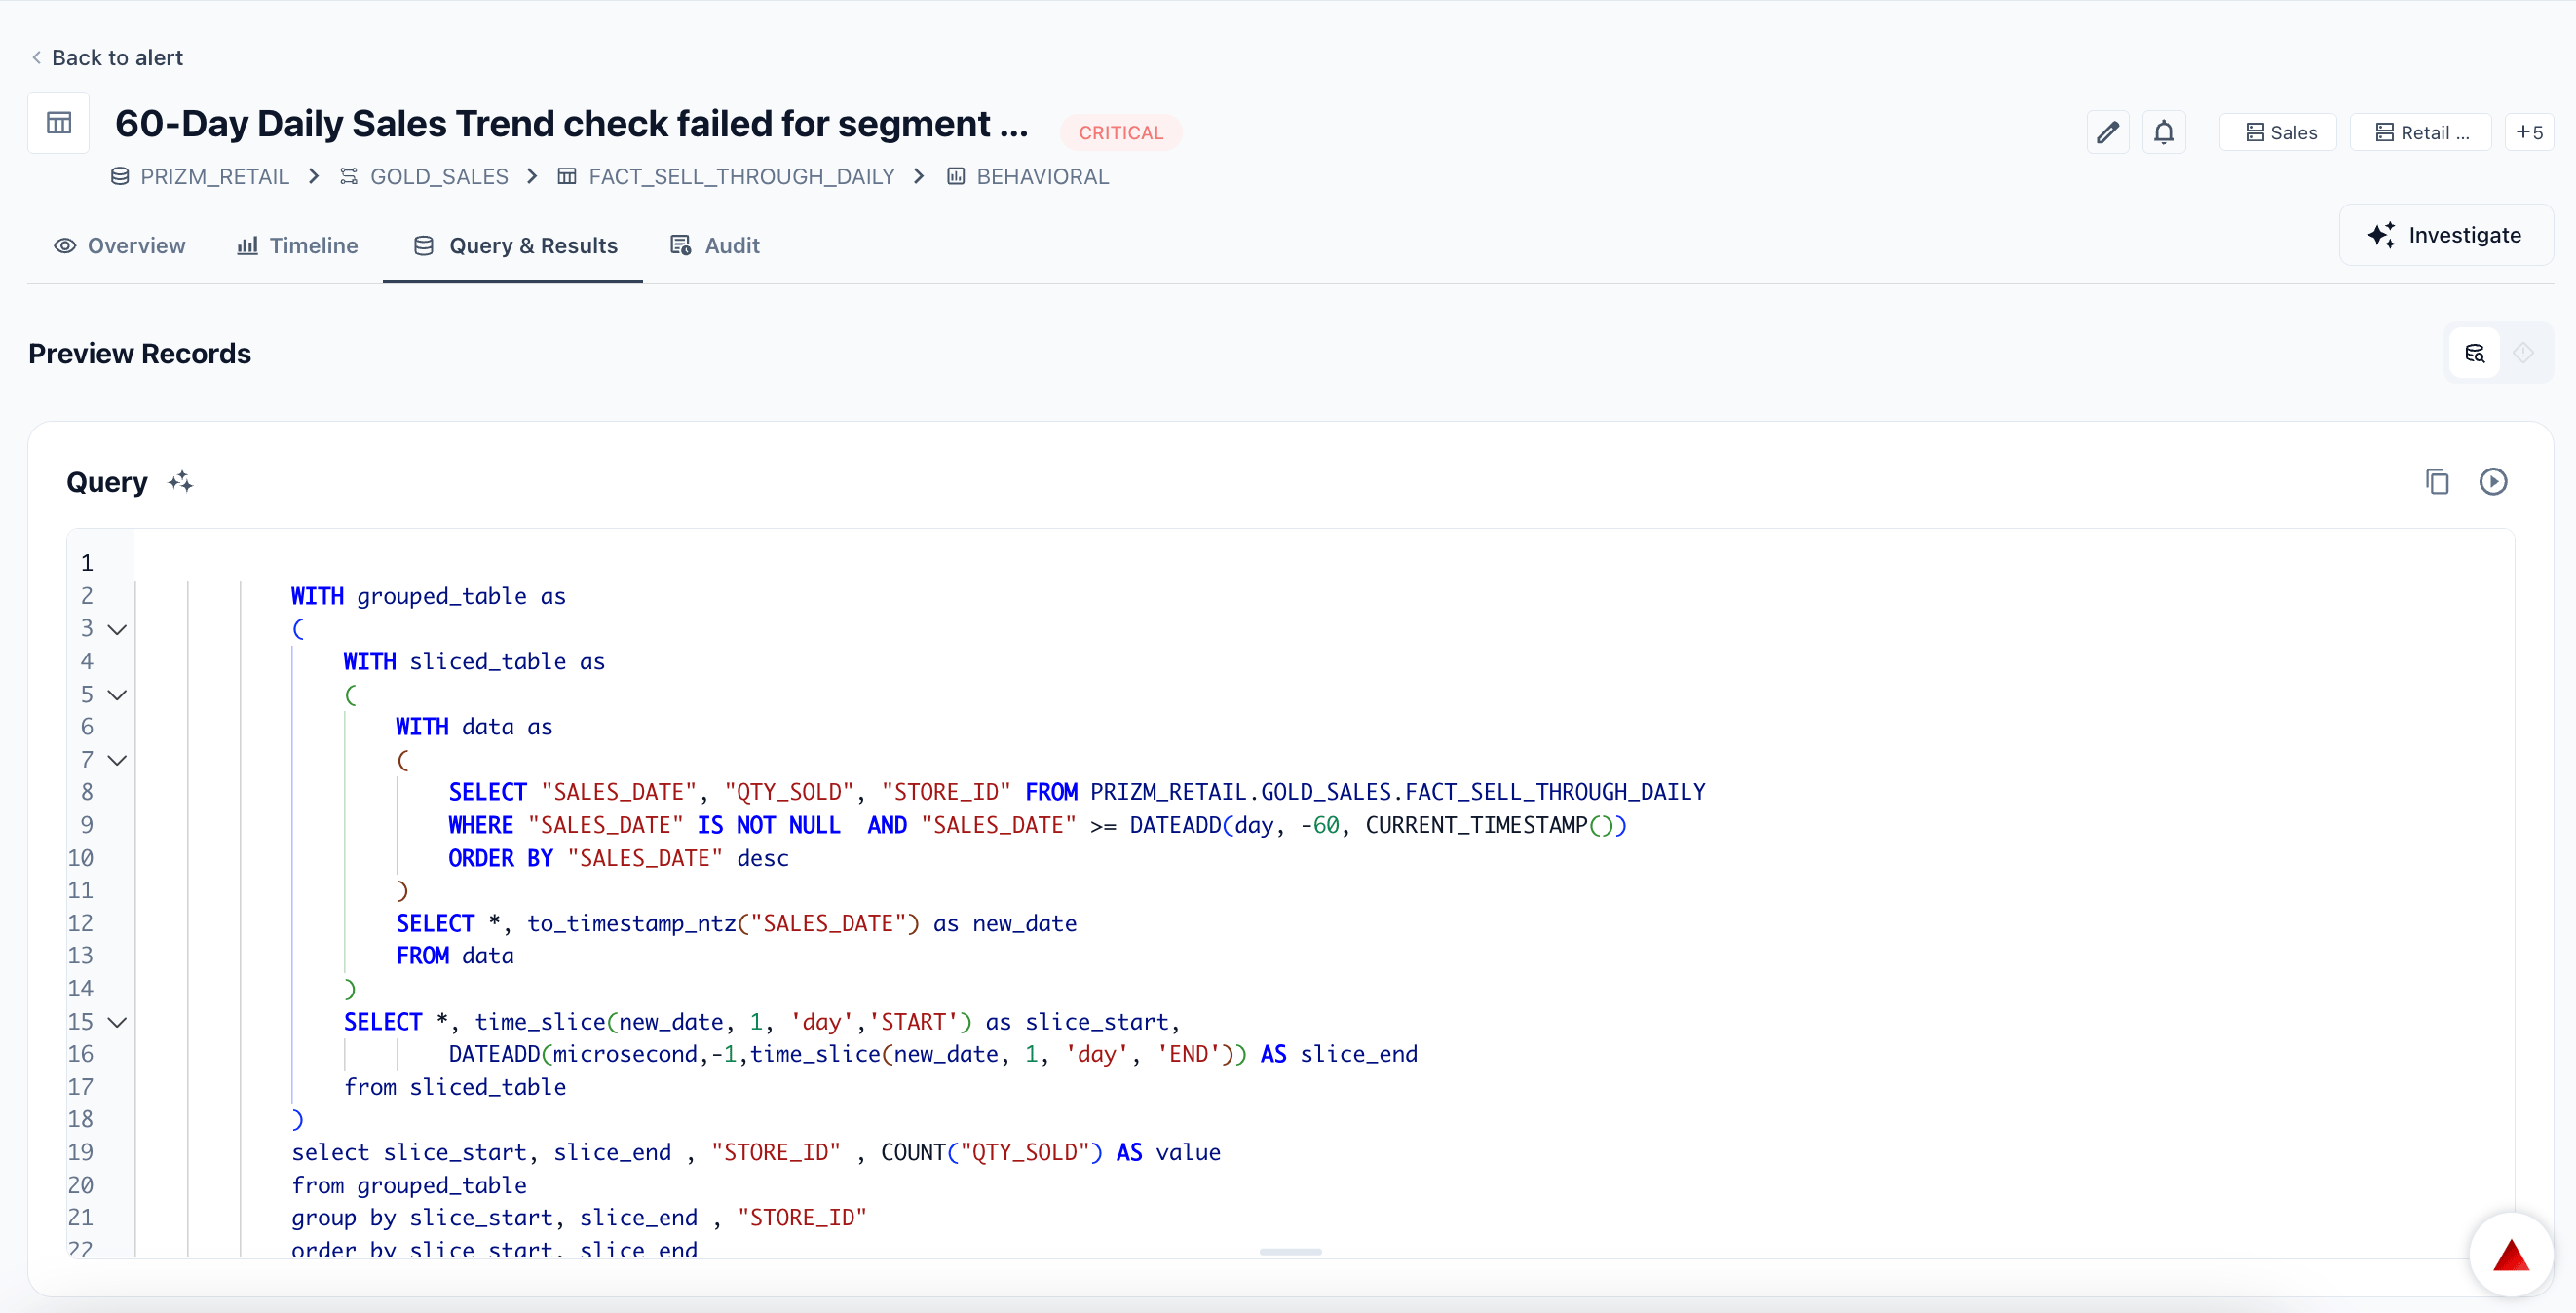
 The SQL query Prizm ran to evaluate the metric, alongside a live preview of the records it returned. See exactly which rows triggered the alert without leaving the page.
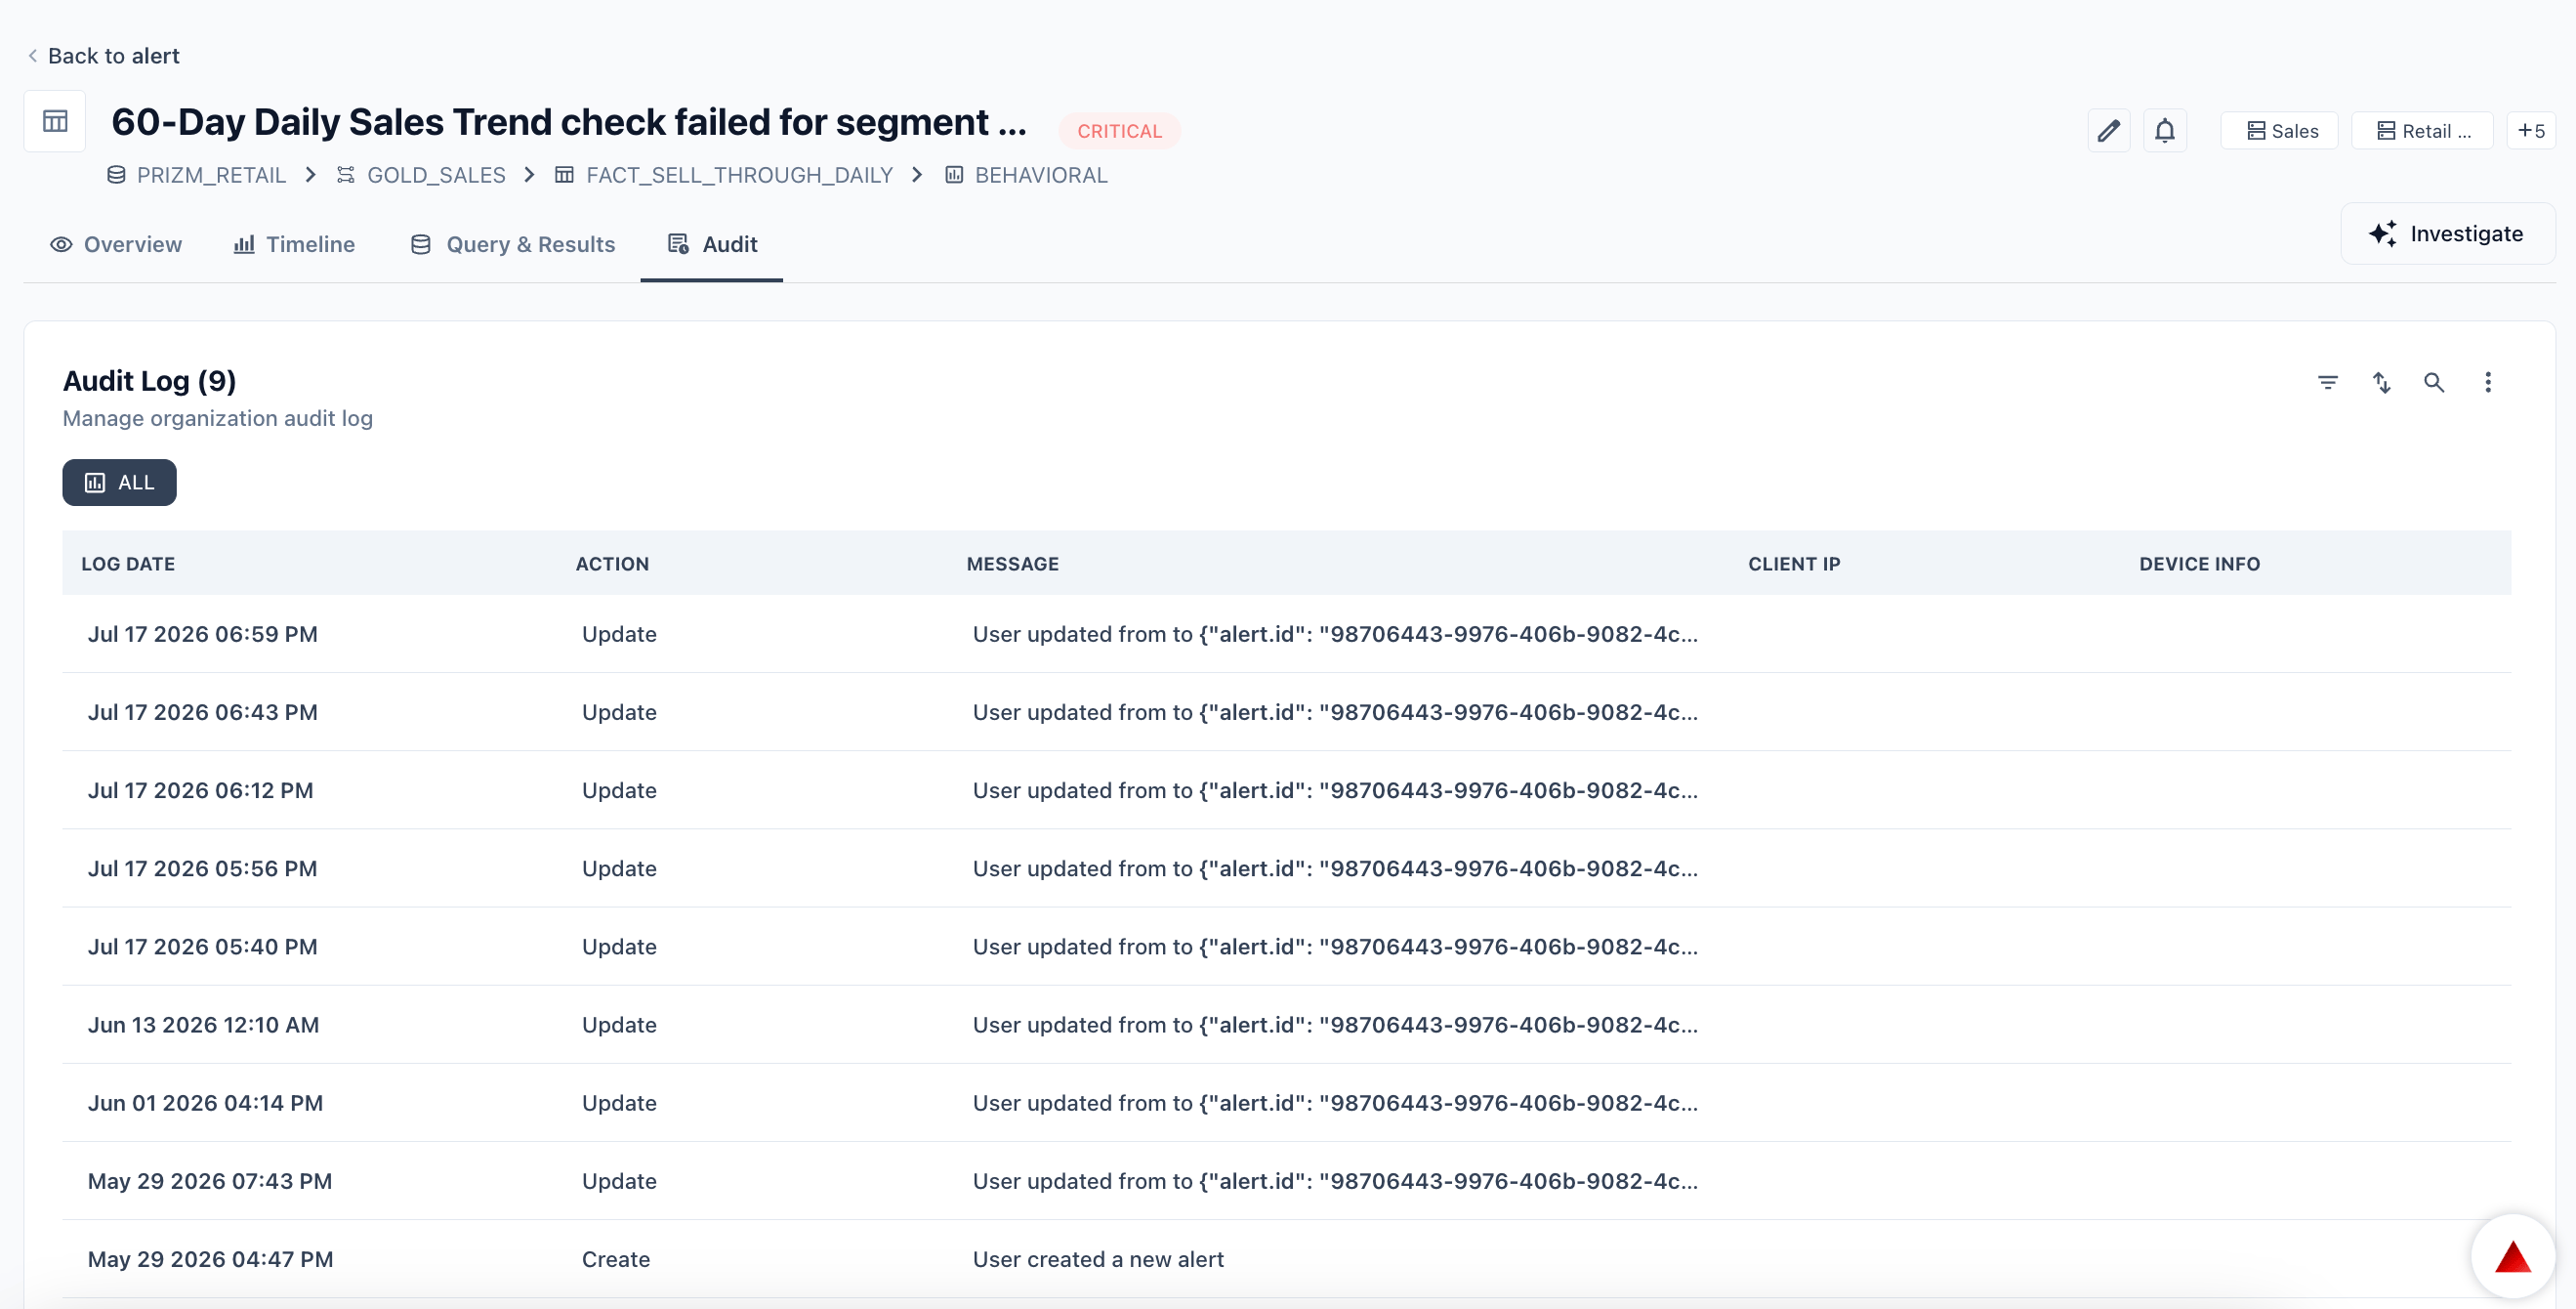
 A chronological log of every action taken on the alert — state changes, notes, suppressions, issue links — separate from the asset's own audit trail.
 ***
## Alert Cluster
If this alert belongs to a cluster (a group of related alerts sharing a common root cause or failure pattern), a cluster summary appears on the detail page:
| Field | Description |
| --------------------- | ------------------------------------------------------------------------- |
| **Cluster name** | Name assigned to the cluster |
| **Description** | What the cluster represents — shared root cause or common failure pattern |
| **Assets impacted** | Number of distinct assets with alerts in the cluster |
| **Alerts in cluster** | Total alerts grouped under this cluster |
| **Cluster created** | When the cluster was first formed |
***
## Alert Cluster
If this alert belongs to a cluster (a group of related alerts sharing a common root cause or failure pattern), a cluster summary appears on the detail page:
| Field | Description |
| --------------------- | ------------------------------------------------------------------------- |
| **Cluster name** | Name assigned to the cluster |
| **Description** | What the cluster represents — shared root cause or common failure pattern |
| **Assets impacted** | Number of distinct assets with alerts in the cluster |
| **Alerts in cluster** | Total alerts grouped under this cluster |
| **Cluster created** | When the cluster was first formed |
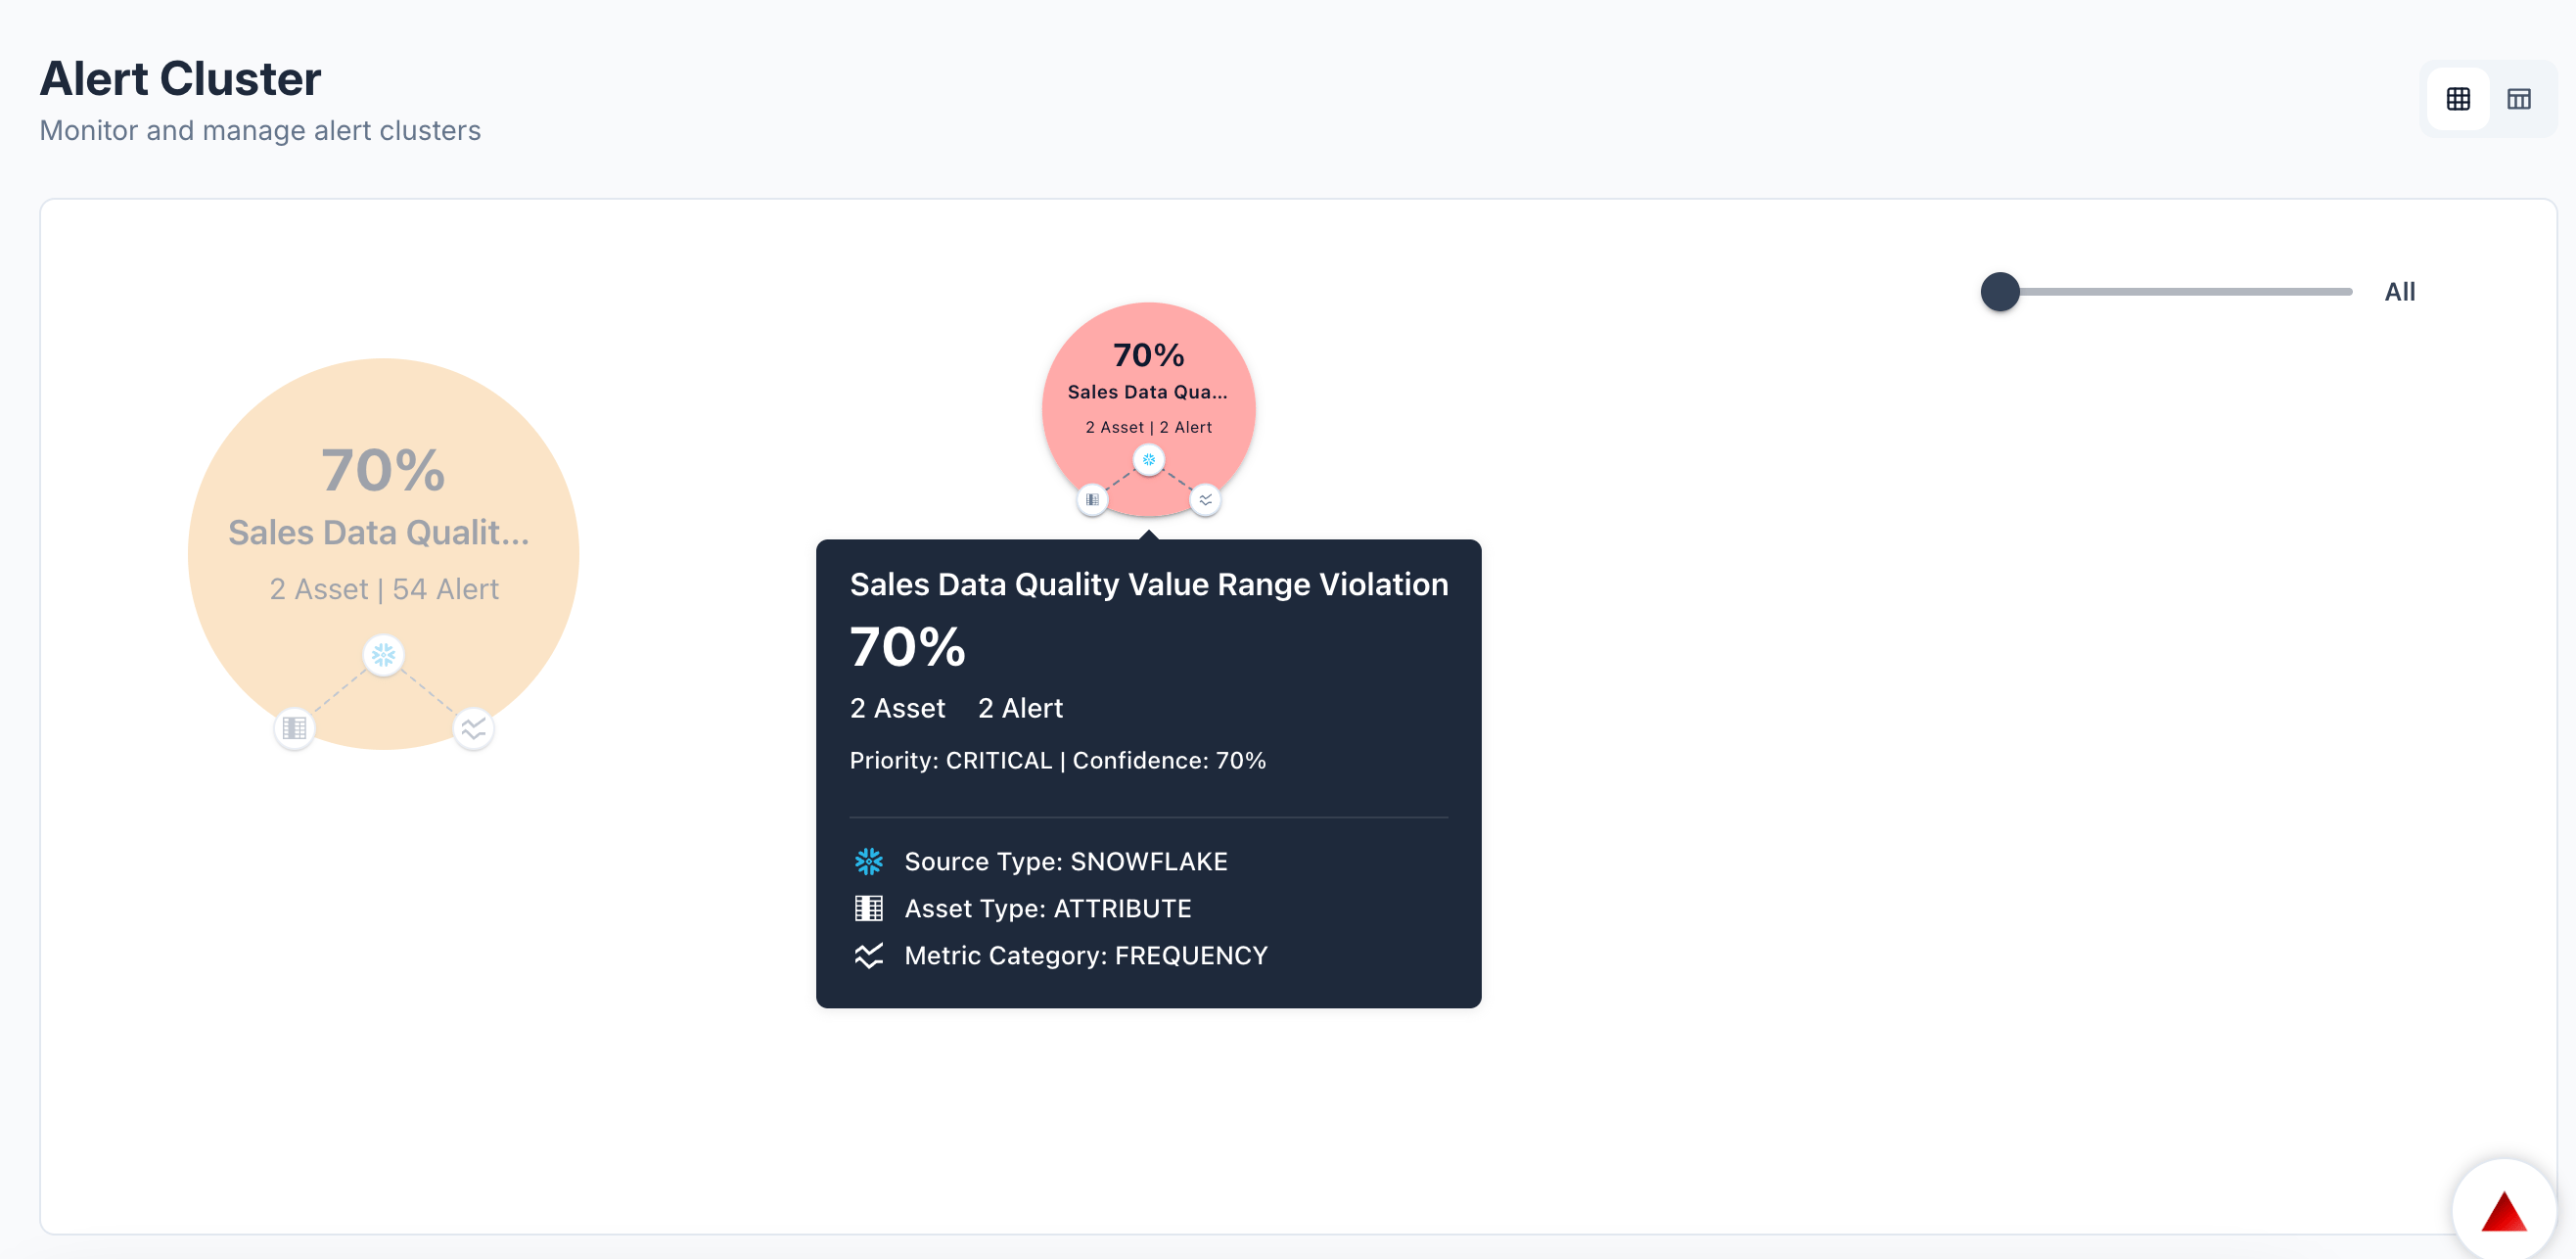 Click the cluster name to open the cluster view, where all member alerts are listed together with shared context.
**Cluster lifecycle:**
| Stage | Description |
| ------------ | ----------------------------------------------------------------------------------------- |
| **Formed** | Created when a correlated group of alerts is first detected |
| **Active** | Remains active while at least one member alert is Active; new related alerts can be added |
| **Resolved** | Closes when all member alerts are resolved or marked as normal |
Resolving a cluster does not automatically resolve its member alerts. Each alert must still be individually resolved. The cluster closes when all members are resolved.
***
## Triaging an alert
1. Read the **AI-generated title and Summary** to understand what happened and how serious it is before looking at raw numbers.
2. Check the **Alert context** panel for the exact breach value and threshold.
3. Review **Impact Analysis** to understand downstream exposure and whether consumers need to be notified.
4. Follow the **Root Cause Analysis** steps starting with Step 1 — each step names a specific asset or layer to inspect.
5. Check the **Timeline** tab to determine when the issue started and whether it is recurring.
6. Update the **Status** — mark as normal if no action is needed, or link/create an issue to track remediation. See [Alert Management](/architecture/alerts/management) for lifecycle details.
AI Insights quality improves as more context (descriptions, domain tags, lineage) is populated on your assets. Use the **Refresh** button on any AI module to regenerate from the latest alert state.
Click the cluster name to open the cluster view, where all member alerts are listed together with shared context.
**Cluster lifecycle:**
| Stage | Description |
| ------------ | ----------------------------------------------------------------------------------------- |
| **Formed** | Created when a correlated group of alerts is first detected |
| **Active** | Remains active while at least one member alert is Active; new related alerts can be added |
| **Resolved** | Closes when all member alerts are resolved or marked as normal |
Resolving a cluster does not automatically resolve its member alerts. Each alert must still be individually resolved. The cluster closes when all members are resolved.
***
## Triaging an alert
1. Read the **AI-generated title and Summary** to understand what happened and how serious it is before looking at raw numbers.
2. Check the **Alert context** panel for the exact breach value and threshold.
3. Review **Impact Analysis** to understand downstream exposure and whether consumers need to be notified.
4. Follow the **Root Cause Analysis** steps starting with Step 1 — each step names a specific asset or layer to inspect.
5. Check the **Timeline** tab to determine when the issue started and whether it is recurring.
6. Update the **Status** — mark as normal if no action is needed, or link/create an issue to track remediation. See [Alert Management](/architecture/alerts/management) for lifecycle details.
AI Insights quality improves as more context (descriptions, domain tags, lineage) is populated on your assets. Use the **Refresh** button on any AI module to regenerate from the latest alert state.