> ## Documentation Index
> Fetch the complete documentation index at: https://docs.dqlabs.ai/llms.txt
> Use this file to discover all available pages before exploring further.
# Alerts Overview
> How alerting works in Prizm — threshold types, alert states, suppression, and clusters.
Prizm Alerts fire automatically when a metric crosses its configured threshold. For an introduction to alert priority levels, the alert list columns, AI-powered triage, and issue creation, see [Alerts in Core Concepts](/core_concepts/alerts).
This section covers the operational detail: how thresholds are configured, how alerts move through their lifecycle, how suppression works, and how alert clusters group related failures.
 ## How alerts are generated
```text theme={null}
Metric runs → Value evaluated against threshold → Threshold breached → Alert created
│
Auto-resolved on next passing run,
or managed manually through lifecycle
```
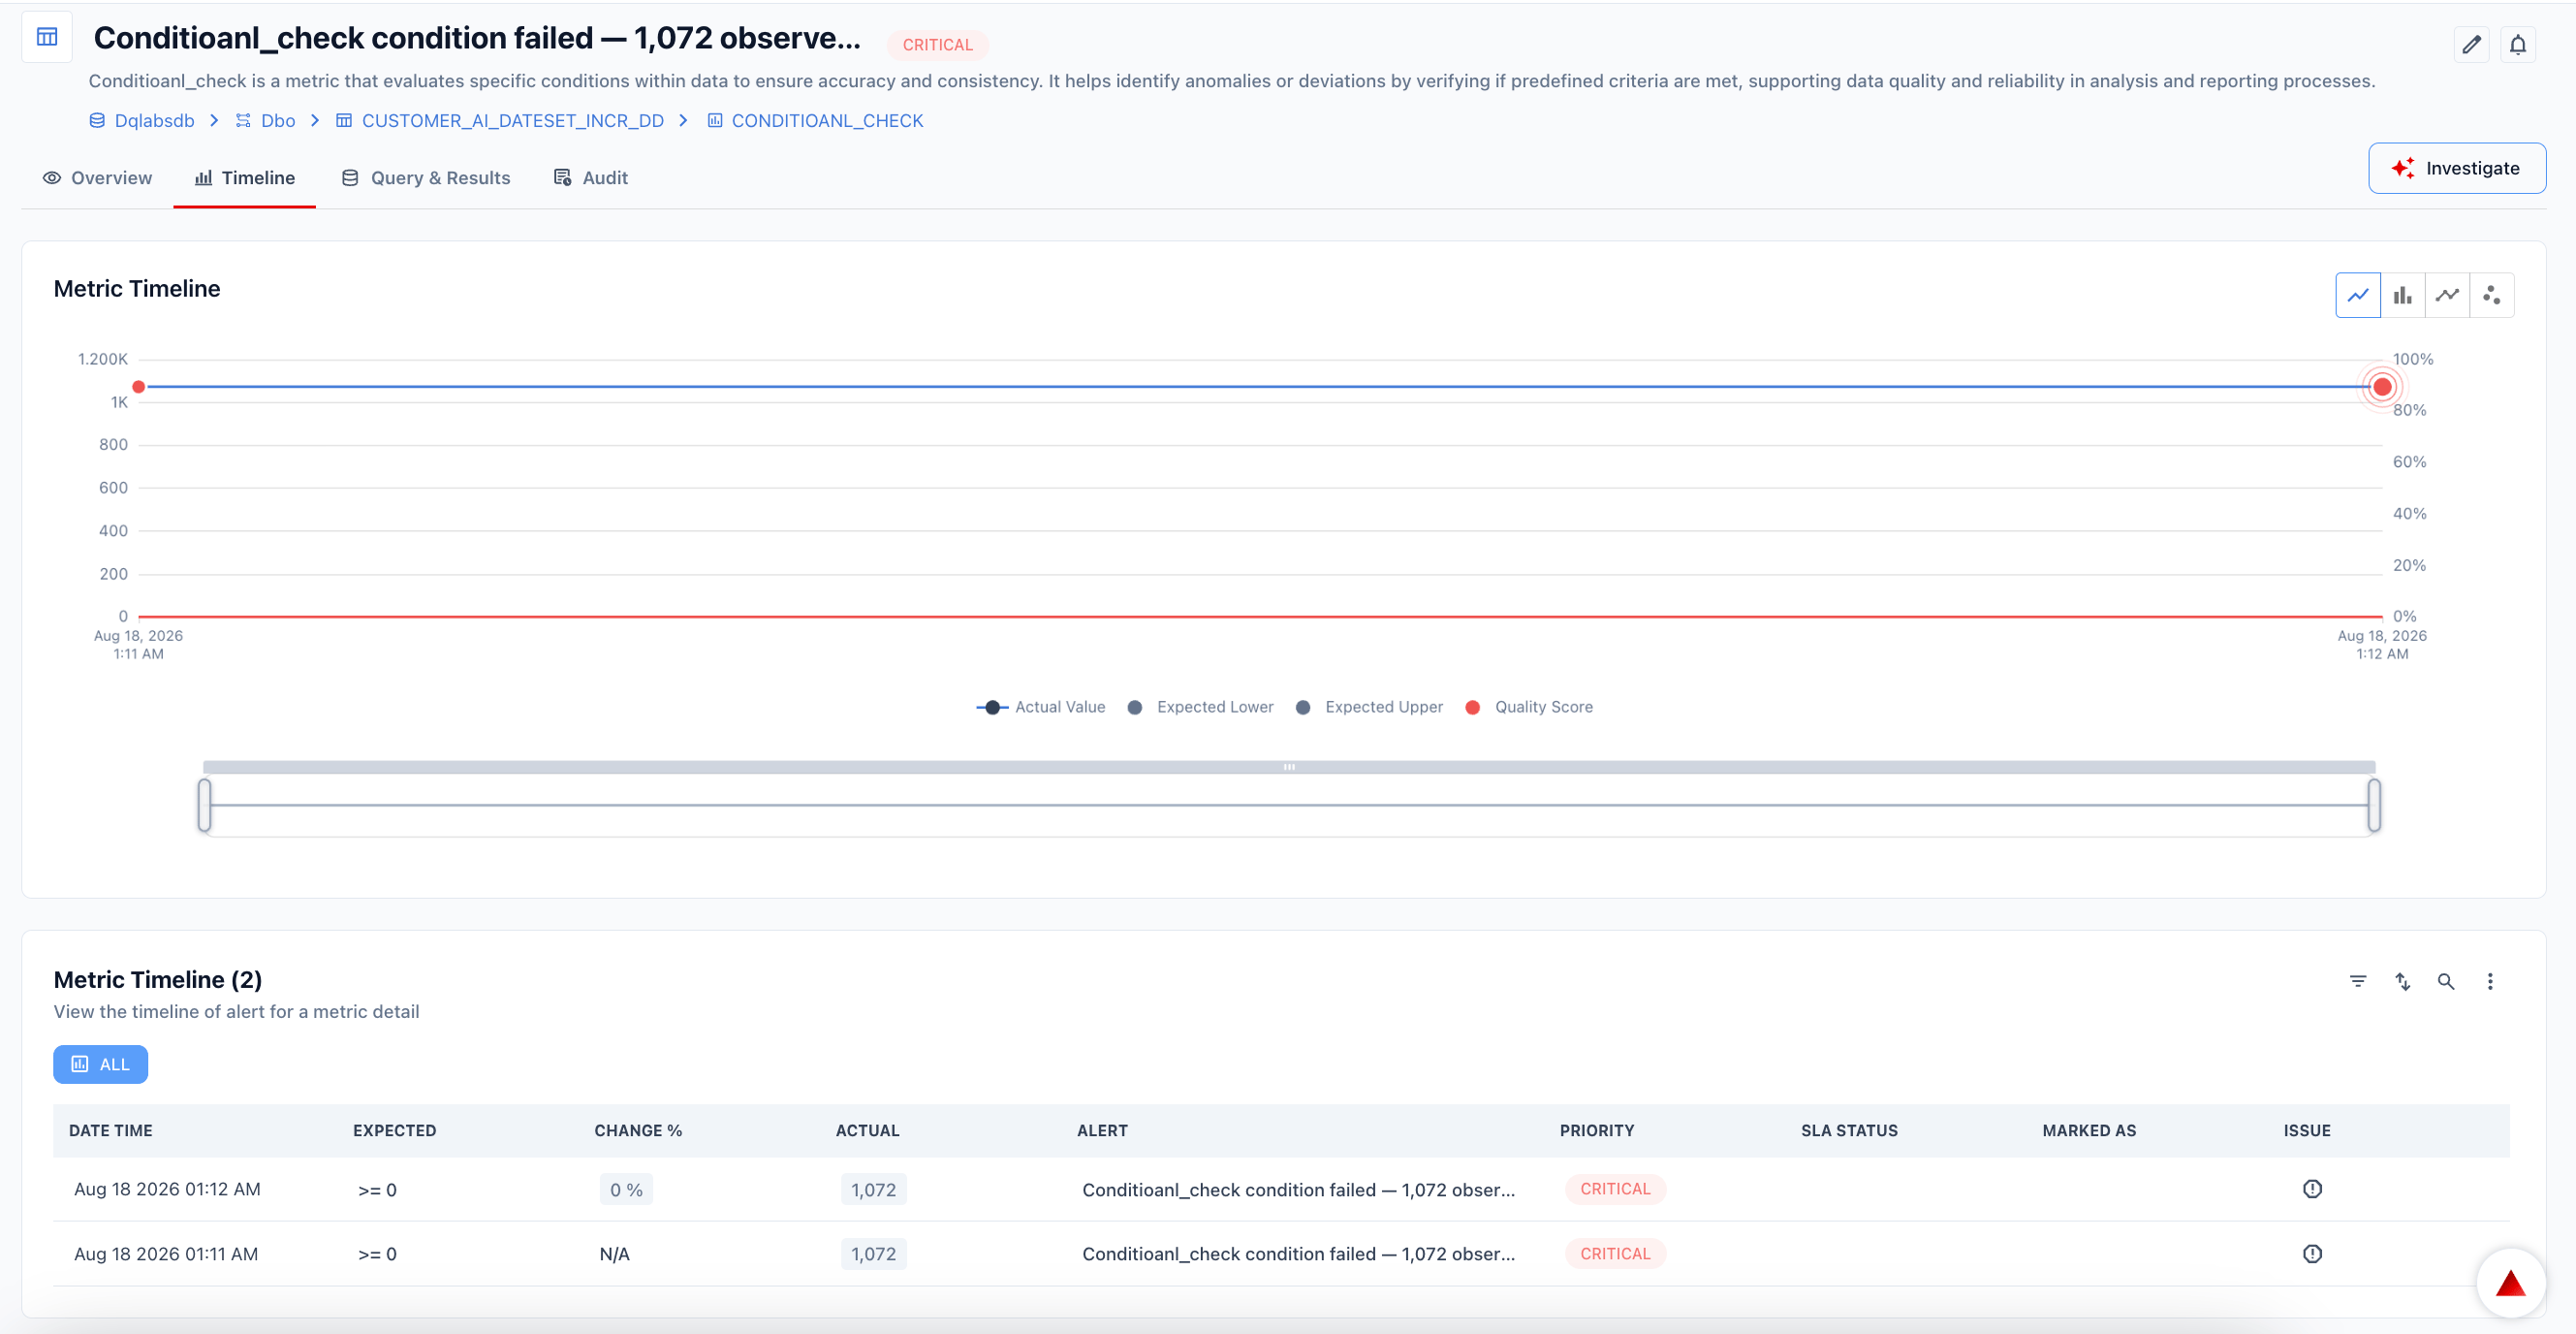
Every failed metric run that breaches its threshold produces an alert. If the metric recovers on the next run, Prizm auto-resolves the alert within that evaluation cycle. If the breach persists, the alert stays Active.
## Alert states
| State | Meaning |
| ------------------ | ------------------------------------------------------------------------- |
| **Active** | Metric is currently breaching its threshold; alert is open |
| **Mark as Normal** | Reviewed and determined not to need a tracked issue; a note is required |
| **Resolved** | Metric has recovered; closed automatically by Prizm or manually by a user |
Suppressed is not a state. An alert inside a suppression window remains **Active** — only notifications are paused. See [Alert Management](/Architecture/alerts/alert-management).
## Threshold types
| Type | How it works |
| ---------- | -------------------------------------------------------------------------------------------------------------------------------------------------------------------------------------- |
| **Auto** | ML-based anomaly detection using a statistical baseline (rolling mean ± σ). Learns from run history. Each sigma band has its own configurable action. |
| **Limit** | A single explicit bound you define. Fires when the metric value crosses it. |
| **Custom** | One or more named criteria, each with its own rule type, conditions, priority, and action. Criteria are evaluated independently per run — available for Query and Conditional metrics. |
## Alert clusters
When multiple alerts fire in a correlated pattern — across related assets, at the same time, or from the same upstream source — Prizm groups them into an **Alert Cluster**. A cluster captures the shared context: name, description, assets impacted, total alerts, and creation timeline. Investigating the oldest member alert in a cluster typically leads to the root cause fastest.
## Alert suppression
Suppression pauses notifications for a defined window or scope. Metric checks still run and breaches are still recorded in the audit log — only notifications are paused.
| Mode | Scope | Use case |
| ---------------------- | ---------------------------------------------------------- | ------------------------------------------------------------ |
| **Maintenance window** | Asset, schema, or source — scheduled recurring or one-time | ETL maintenance, deployments, recurring upstream delays |
| **Global suppress** | Entire organization — manual, time-bounded | Active incidents where all noise should be silenced org-wide |
***
AI-generated triage context, impact analysis, root cause steps, timeline, and alert clusters.
Alert states, issue linkage, and suppression configuration.
Auto, Limit, and Custom threshold types — including multi-criteria rules and per-condition actions.
## How alerts are generated
```text theme={null}
Metric runs → Value evaluated against threshold → Threshold breached → Alert created
│
Auto-resolved on next passing run,
or managed manually through lifecycle
```
Every failed metric run that breaches its threshold produces an alert. If the metric recovers on the next run, Prizm auto-resolves the alert within that evaluation cycle. If the breach persists, the alert stays Active.
## Alert states
| State | Meaning |
| ------------------ | ------------------------------------------------------------------------- |
| **Active** | Metric is currently breaching its threshold; alert is open |
| **Mark as Normal** | Reviewed and determined not to need a tracked issue; a note is required |
| **Resolved** | Metric has recovered; closed automatically by Prizm or manually by a user |
Suppressed is not a state. An alert inside a suppression window remains **Active** — only notifications are paused. See [Alert Management](/Architecture/alerts/alert-management).
## Threshold types
| Type | How it works |
| ---------- | -------------------------------------------------------------------------------------------------------------------------------------------------------------------------------------- |
| **Auto** | ML-based anomaly detection using a statistical baseline (rolling mean ± σ). Learns from run history. Each sigma band has its own configurable action. |
| **Limit** | A single explicit bound you define. Fires when the metric value crosses it. |
| **Custom** | One or more named criteria, each with its own rule type, conditions, priority, and action. Criteria are evaluated independently per run — available for Query and Conditional metrics. |
## Alert clusters
When multiple alerts fire in a correlated pattern — across related assets, at the same time, or from the same upstream source — Prizm groups them into an **Alert Cluster**. A cluster captures the shared context: name, description, assets impacted, total alerts, and creation timeline. Investigating the oldest member alert in a cluster typically leads to the root cause fastest.
## Alert suppression
Suppression pauses notifications for a defined window or scope. Metric checks still run and breaches are still recorded in the audit log — only notifications are paused.
| Mode | Scope | Use case |
| ---------------------- | ---------------------------------------------------------- | ------------------------------------------------------------ |
| **Maintenance window** | Asset, schema, or source — scheduled recurring or one-time | ETL maintenance, deployments, recurring upstream delays |
| **Global suppress** | Entire organization — manual, time-bounded | Active incidents where all noise should be silenced org-wide |
***
AI-generated triage context, impact analysis, root cause steps, timeline, and alert clusters.
Alert states, issue linkage, and suppression configuration.
Auto, Limit, and Custom threshold types — including multi-criteria rules and per-condition actions.