> ## Documentation Index
> Fetch the complete documentation index at: https://docs.dqlabs.ai/llms.txt
> Use this file to discover all available pages before exploring further.
# Alert Thresholds
> How to configure Auto, Limit, and Custom alert thresholds for Prizm metrics — including multi-criteria custom rules, sensitivity tuning, and per-condition actions.
A threshold defines when a metric value is considered anomalous and should fire an alert. Prizm provides three threshold types — **Auto**, **Limit**, and **Custom** — selectable from the metric's Configuration tab.
## Threshold types
| Type | Best for | How it works |
| ---------- | ------------------------------------------------------------------------------------------- | ------------------------------------------------------------------------------------ |
| **Auto** | Metrics with variable historical patterns | ML-based anomaly detection using a statistical baseline. Learns from run history. |
| **Limit** | Metrics with known, fixed acceptable ranges | A single explicit bound defined by the user. Fires when the value crosses the limit. |
| **Custom** | Metrics needing multiple named alert criteria with different rules, priorities, and actions | One or more named criteria evaluated independently per run. |
***
## Auto threshold
Auto thresholds use statistical models trained on a metric's historical run values to detect anomalies. Prizm calculates a rolling mean and standard deviation, then flags values that deviate beyond the configured sigma bands.
| Band | Default action |
| ----------------- | ------------------- |
| Within 2σ | No alert |
| Between 2σ and 3σ | Medium / High alert |
| Beyond 3σ | Critical alert |
### Sensitivity and lookback
| Setting | Effect |
| ------------------------------- | -------------------------------------------- |
| **Tight** (lower σ multiplier) | Narrower bands — more sensitive, more alerts |
| **Standard** | Default bands |
| **Loose** (higher σ multiplier) | Wider bands — less sensitive, fewer alerts |
The **lookback window** (7 days to 1 year) controls what historical data the baseline mean and standard deviation are computed from. A shorter window makes the baseline more reactive to recent changes; a longer window gives a more stable baseline.
Each sigma band has its own **action** — for example, Medium band can notify the owner while Critical blocks the pipeline:
| Action | Effect |
| ------------------ | ---------------------------------------------------------- |
| **No action** | Alert recorded, no notification triggered |
| **Notify owner** | Sends a notification to the asset owner and alert audience |
| **Create issue** | Automatically creates a Prizm issue linked to this alert |
| **Block pipeline** | Signals downstream orchestrators to halt execution |
Auto thresholds require a minimum number of historical runs before they become active. During this period the metric is in **Learning** mode and no alert fires.
Prizm also supports **drift detection** — if the metric value shifts gradually over time rather than spiking, drift mode catches the sustained trend before it becomes a hard threshold breach.
***
## Limit threshold
Limit thresholds let you define an explicit bound based on known business rules — useful when historical data is not a reliable guide for what "normal" looks like.
### Condition types
| Condition | Example |
| ---------------------------- | ------------------------------------------- |
| **Equal to** | `= 0` (zero-tolerance null check) |
| **Not equal to** | `≠ 100` (completeness must be exactly 100%) |
| **Greater than** | `> 500` |
| **Greater than or equal to** | `>= 1000` |
| **Less than** | `< 0.95` (95% completeness SLA) |
| **Less than or equal to** | `<= 0` |
| **Between** | Between `0.98` and `1.02` |
### How to set a Limit threshold
Navigate to the metric and open the **Configuration** tab.
Under **Threshold**, select **Limit** and choose a condition type.
Enter the bound. For **Between**, set both lower and upper bounds.
Choose the severity that fires when the limit is breached: Critical, High, Medium, or Low.
 Click **Save Changes**. The threshold takes effect on the next metric run.
**Mark as Normal** is not available for Limit threshold metrics. Alerts from Limit thresholds can only be Active or Resolved.
***
## Custom threshold
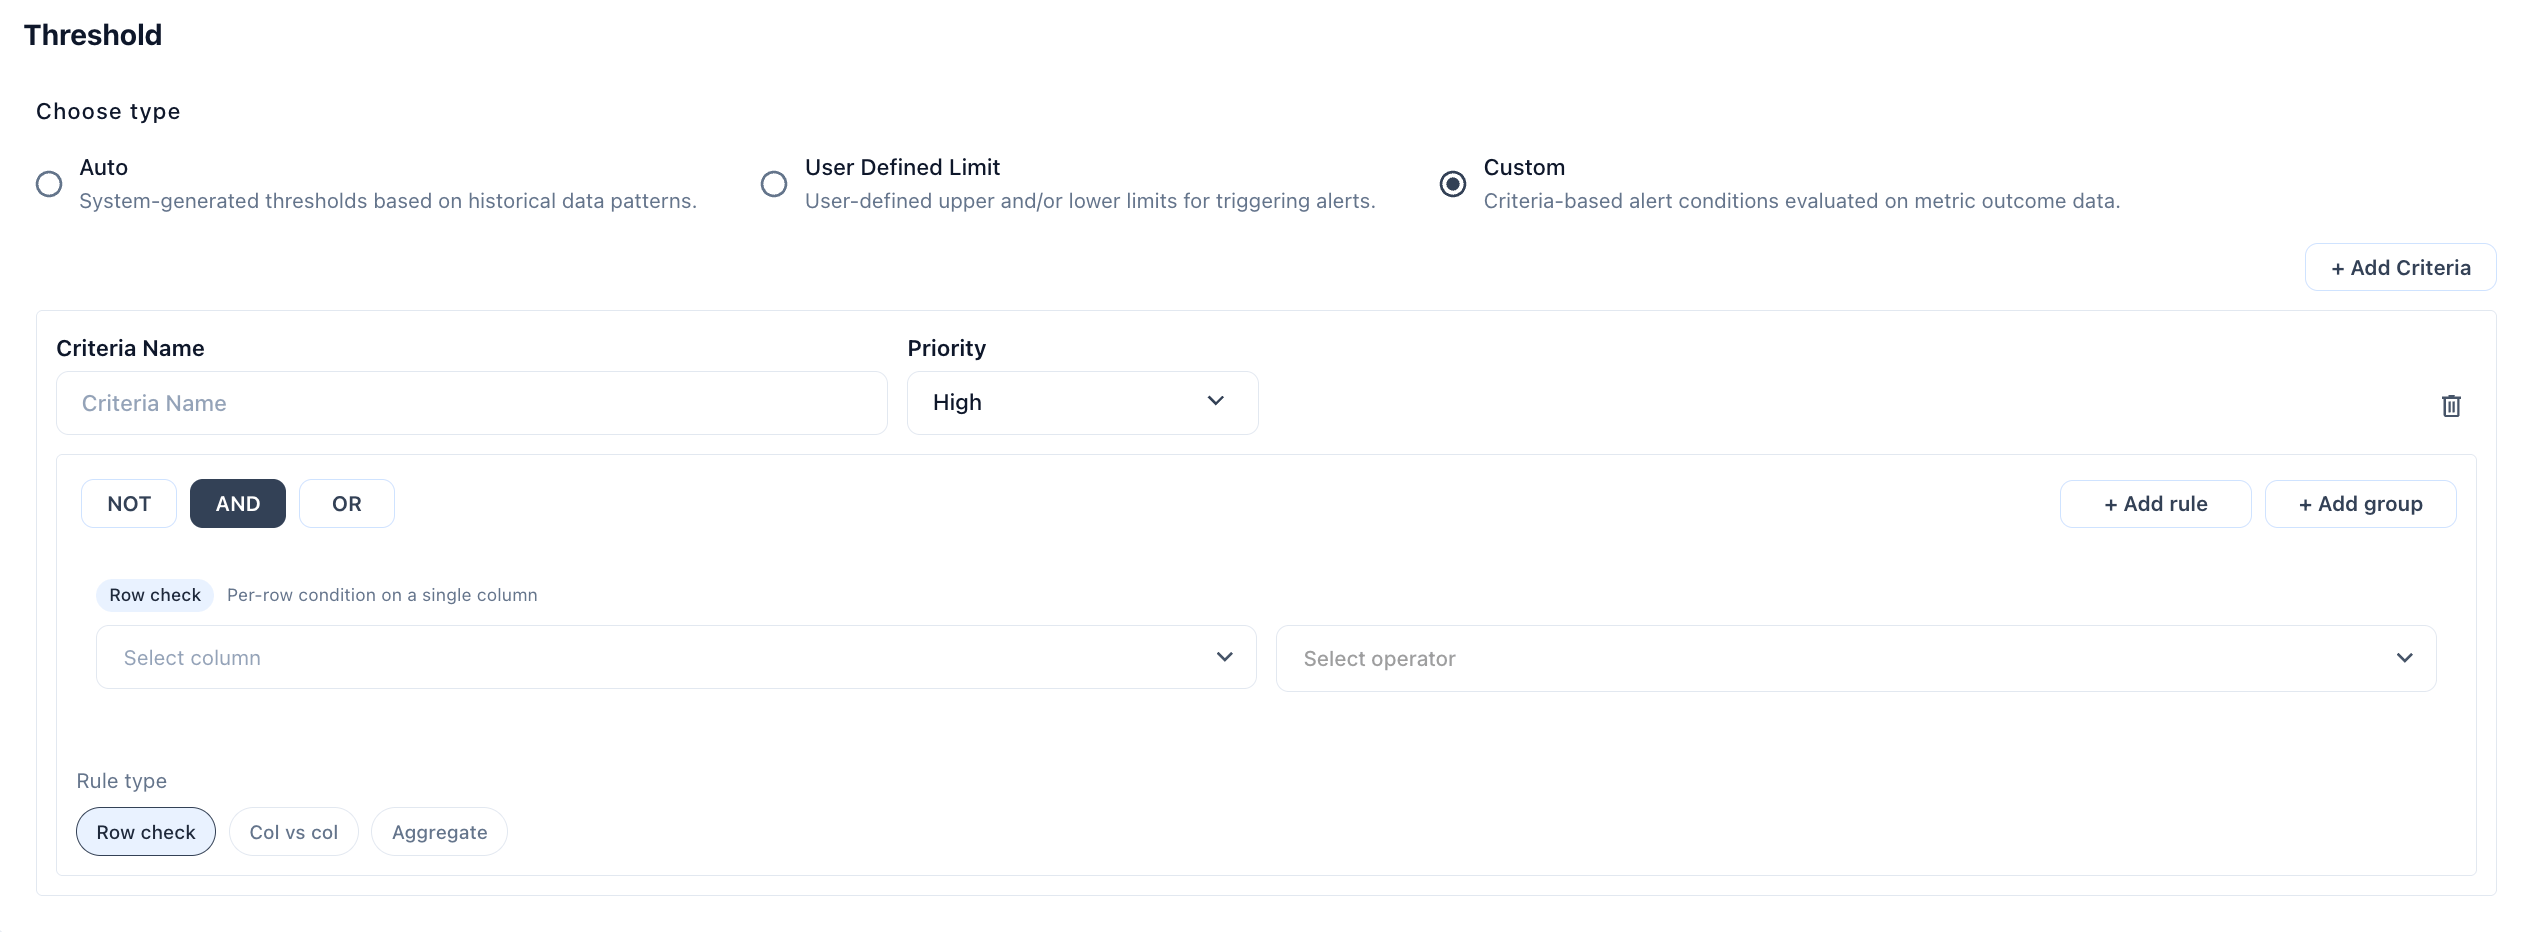
Custom threshold lets you define one or more named **criteria**, each with its own rule type, conditions, priority, and action. Criteria are evaluated independently — if multiple criteria are satisfied in a single run, Prizm generates an alert for each one.
Custom threshold is available for **Query metrics** and **Conditional metrics**.
### Criteria structure
Each criterion requires:
| Field | Description |
| ----------------- | ---------------------------------------------------------------- |
| **Criteria name** | A label for this alert condition (e.g., `High Sales Alert`) |
| **Priority** | Severity if this criterion fires: Critical, High, Medium, or Low |
| **Rule type** | The type of check to perform |
| **Condition** | The comparison logic |
| **Action** | What Prizm does when this criterion fires |
### Rule types
**Row Check** — Evaluates a condition against individual rows. Fires if any row matches. Example: `QTY_SOLD Between 10 and 20`
**Column vs Column** — Compares two columns row by row. Fires if any row satisfies the comparison. Example: `ACTUAL_REVENUE < FORECAST_REVENUE`
**Aggregate** — Applies an aggregate function and evaluates the result against a threshold. Example: `SUM(REVENUE) < 1000`
### Condition operators
| Operator | Description |
| ---------------------------------------- | ----------------------------------------------------- |
| **Greater / Less / Equal to** | Standard comparison against a fixed value |
| **Between** | Value falls within a min–max range |
| **Changed by more than** | Value changed by more than N units since the last run |
| **Changed by more than % from last run** | Value changed by more than N% since the last run |
### Value unit toggle
For numeric conditions, a three-way toggle controls how the value is interpreted:
| Symbol | Meaning |
| ------ | ------------------------------------------------ |
| `#` | Absolute count |
| `%` | Percentage of total rows or metric value |
| `Δ%` | Percentage change from the previous run's result |
### Multiple criteria example
| Criterion | Rule | Priority | Action |
| ----------------- | ---------------------------------------- | -------- | ------------ |
| High Sales Alert | Row Check — `QTY_SOLD Between 10 and 20` | High | Notify owner |
| Low Revenue Alert | Aggregate — `SUM(REVENUE) < 1000` | Medium | Create issue |
If both conditions are met in the same run, both alerts fire independently.
### Advanced options
**Apply to filtered rows only** — When conditional rules filter the metric (e.g., `WHERE STATUS = 'closed'`), enabling this option scopes the threshold evaluation to only the filtered rows rather than the full table.
**Consecutive runs requirement** — Requires the condition to be met for N consecutive runs before an alert fires. Prevents single-run spikes from triggering alerts while still catching persistent issues.
***
## Switching between threshold types
You can switch a metric between Auto, Limit, and Custom at any time. When switching away from Auto, the historical learning data is preserved — switching back resumes from the last model state.
## Thresholds and quality scoring
Threshold breach status feeds into the asset quality score. A metric in breach reduces the asset's score by its configured **Weightage %**. The score contribution is restored when the metric returns to a valid range or the alert is manually resolved.
Click **Save Changes**. The threshold takes effect on the next metric run.
**Mark as Normal** is not available for Limit threshold metrics. Alerts from Limit thresholds can only be Active or Resolved.
***
## Custom threshold
Custom threshold lets you define one or more named **criteria**, each with its own rule type, conditions, priority, and action. Criteria are evaluated independently — if multiple criteria are satisfied in a single run, Prizm generates an alert for each one.
Custom threshold is available for **Query metrics** and **Conditional metrics**.
### Criteria structure
Each criterion requires:
| Field | Description |
| ----------------- | ---------------------------------------------------------------- |
| **Criteria name** | A label for this alert condition (e.g., `High Sales Alert`) |
| **Priority** | Severity if this criterion fires: Critical, High, Medium, or Low |
| **Rule type** | The type of check to perform |
| **Condition** | The comparison logic |
| **Action** | What Prizm does when this criterion fires |
### Rule types
**Row Check** — Evaluates a condition against individual rows. Fires if any row matches. Example: `QTY_SOLD Between 10 and 20`
**Column vs Column** — Compares two columns row by row. Fires if any row satisfies the comparison. Example: `ACTUAL_REVENUE < FORECAST_REVENUE`
**Aggregate** — Applies an aggregate function and evaluates the result against a threshold. Example: `SUM(REVENUE) < 1000`
### Condition operators
| Operator | Description |
| ---------------------------------------- | ----------------------------------------------------- |
| **Greater / Less / Equal to** | Standard comparison against a fixed value |
| **Between** | Value falls within a min–max range |
| **Changed by more than** | Value changed by more than N units since the last run |
| **Changed by more than % from last run** | Value changed by more than N% since the last run |
### Value unit toggle
For numeric conditions, a three-way toggle controls how the value is interpreted:
| Symbol | Meaning |
| ------ | ------------------------------------------------ |
| `#` | Absolute count |
| `%` | Percentage of total rows or metric value |
| `Δ%` | Percentage change from the previous run's result |
### Multiple criteria example
| Criterion | Rule | Priority | Action |
| ----------------- | ---------------------------------------- | -------- | ------------ |
| High Sales Alert | Row Check — `QTY_SOLD Between 10 and 20` | High | Notify owner |
| Low Revenue Alert | Aggregate — `SUM(REVENUE) < 1000` | Medium | Create issue |
If both conditions are met in the same run, both alerts fire independently.
### Advanced options
**Apply to filtered rows only** — When conditional rules filter the metric (e.g., `WHERE STATUS = 'closed'`), enabling this option scopes the threshold evaluation to only the filtered rows rather than the full table.
**Consecutive runs requirement** — Requires the condition to be met for N consecutive runs before an alert fires. Prevents single-run spikes from triggering alerts while still catching persistent issues.
***
## Switching between threshold types
You can switch a metric between Auto, Limit, and Custom at any time. When switching away from Auto, the historical learning data is preserved — switching back resumes from the last model state.
## Thresholds and quality scoring
Threshold breach status feeds into the asset quality score. A metric in breach reduces the asset's score by its configured **Weightage %**. The score contribution is restored when the metric returns to a valid range or the alert is manually resolved.