> ## Documentation Index
> Fetch the complete documentation index at: https://docs.dqlabs.ai/llms.txt
> Use this file to discover all available pages before exploring further.
# Setup
> Step-by-step guide to creating and configuring a Behavioral metric in Prizm, including grouping dimensions, comparison context, and thresholds.
## Creating a behavioral metric
1. Navigate to **Metric** in the top navigation.
2. Click the **Add** button (⊕).
3. Enter a **Metric Name**.
4. Select **Subcategory: Behavioral** from the dropdown.
5. Enter a **Purpose** description.
6. Click **Create**.
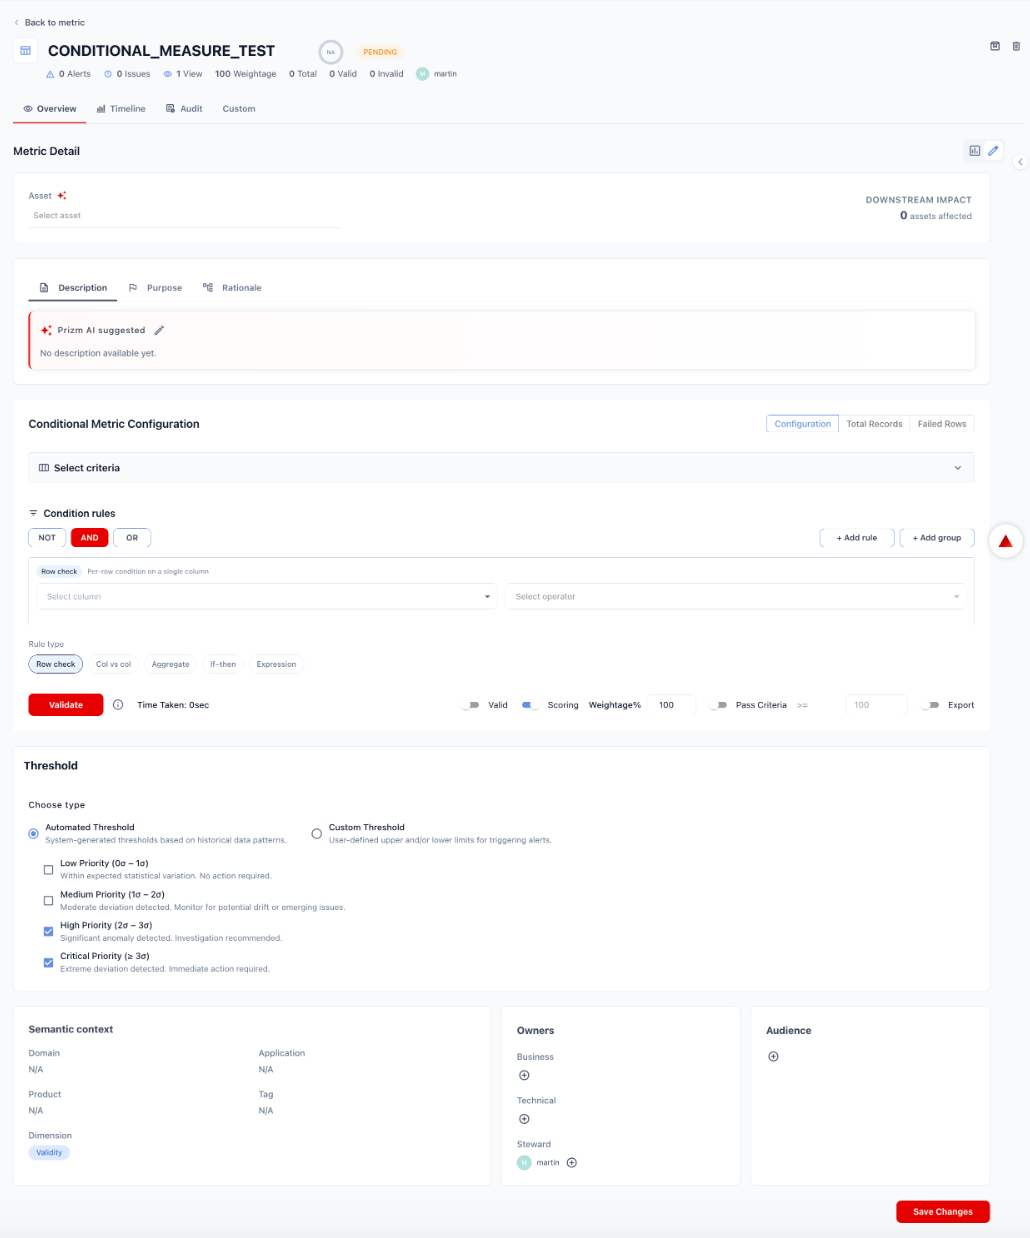 Click the metric name to open its detail page. The behavioral metric configuration view exposes:
* **Asset** — the table the metric runs against
* **Metadata tabs** — Description, Purpose, Rationale
* **Behavioral Metric Configuration** — metric/grain, grouping dimensions, comparison context, and detection settings
* **Threshold**
* **Semantic context** and **Owners**
Click the metric name to open its detail page. The behavioral metric configuration view exposes:
* **Asset** — the table the metric runs against
* **Metadata tabs** — Description, Purpose, Rationale
* **Behavioral Metric Configuration** — metric/grain, grouping dimensions, comparison context, and detection settings
* **Threshold**
* **Semantic context** and **Owners**
 **Asset:** Select the table or view this metric will evaluate. Use the **AI-assisted asset selection** button to let Prizm suggest an asset based on the metric name and purpose.
The **Downstream Impact** counter shows how many other assets depend on this asset.
Fill in the metadata tabs as needed:
| Tab | Content |
| --------------- | --------------------------------------------------------------------------------------- |
| **Description** | What this metric measures. Prizm AI can suggest a description based on the metric name. |
| **Purpose** | Business justification — why this metric exists and what behavior it monitors. |
| **Rationale** | The reasoning behind the aggregate function, grain, and comparison context chosen. |
**Asset:** Select the table or view this metric will evaluate. Use the **AI-assisted asset selection** button to let Prizm suggest an asset based on the metric name and purpose.
The **Downstream Impact** counter shows how many other assets depend on this asset.
Fill in the metadata tabs as needed:
| Tab | Content |
| --------------- | --------------------------------------------------------------------------------------- |
| **Description** | What this metric measures. Prizm AI can suggest a description based on the metric name. |
| **Purpose** | Business justification — why this metric exists and what behavior it monitors. |
| **Rationale** | The reasoning behind the aggregate function, grain, and comparison context chosen. |
 The **Metric & Grain** section defines what aggregate to compute and at what frequency.
#### Aggregate function
Select how to aggregate the target column:
| Function | Description |
| -------------------------- | ------------------------------------------------ |
| **Sum** | Total of all values in the column per time grain |
| **Average** | Mean value across all records per time grain |
| **Median** | Middle value of the distribution per time grain |
| **Percentile (P90 / P95)** | 90th or 95th percentile value per time grain |
| **Count** | Row count per time grain |
| **Ratio** | Ratio of two aggregate values |
Select the **Column** the aggregate applies to from the asset's schema.
#### Time grain
| Grain | Description |
| ---------- | ------------------------------------------- |
| **Daily** | Aggregate and evaluate values once per day |
| **Weekly** | Aggregate and evaluate values once per week |
The **Metric & Grain** section defines what aggregate to compute and at what frequency.
#### Aggregate function
Select how to aggregate the target column:
| Function | Description |
| -------------------------- | ------------------------------------------------ |
| **Sum** | Total of all values in the column per time grain |
| **Average** | Mean value across all records per time grain |
| **Median** | Middle value of the distribution per time grain |
| **Percentile (P90 / P95)** | 90th or 95th percentile value per time grain |
| **Count** | Row count per time grain |
| **Ratio** | Ratio of two aggregate values |
Select the **Column** the aggregate applies to from the asset's schema.
#### Time grain
| Grain | Description |
| ---------- | ------------------------------------------- |
| **Daily** | Aggregate and evaluate values once per day |
| **Weekly** | Aggregate and evaluate values once per week |
 Grouping dimensions segment the metric by one or more attributes — allowing Prizm to detect anomalies at the segment level rather than just the aggregate total.
Select dimensions using the chip selector. No SQL is required — Prizm uses the asset's schema to populate available dimension columns.
**Example:** Adding `region` and `product_category` as grouping dimensions allows Prizm to detect that a volume drop is isolated to one region, rather than being masked in the global total.
Leave grouping dimensions empty to evaluate the aggregate at the full asset level.
Grouping dimensions segment the metric by one or more attributes — allowing Prizm to detect anomalies at the segment level rather than just the aggregate total.
Select dimensions using the chip selector. No SQL is required — Prizm uses the asset's schema to populate available dimension columns.
**Example:** Adding `region` and `product_category` as grouping dimensions allows Prizm to detect that a volume drop is isolated to one region, rather than being masked in the global total.
Leave grouping dimensions empty to evaluate the aggregate at the full asset level.
 The comparison context defines what the current value is compared against to determine whether it is anomalous.
| Context | Description |
| ----------------------- | ------------------------------------------------------------------------------------------------------------------------------------------------------------------------------------------------------ |
| **Historical Baseline** | Compare the current period's value against a rolling window of historical values (7 / 14 / 30 / 90 days). Best for detecting absolute deviations from past behavior. |
| **Peer Group** | Compare one segment's value against the values of peer segments with the same grouping dimensions. Best for detecting relative underperformance — e.g., one region declining while others hold steady. |
| **Period-over-Period** | Compare the current period against the same period in a prior cycle (last week, last month, last year). Best for seasonally adjusted metrics with predictable cycle patterns. |
The comparison context defines what the current value is compared against to determine whether it is anomalous.
| Context | Description |
| ----------------------- | ------------------------------------------------------------------------------------------------------------------------------------------------------------------------------------------------------ |
| **Historical Baseline** | Compare the current period's value against a rolling window of historical values (7 / 14 / 30 / 90 days). Best for detecting absolute deviations from past behavior. |
| **Peer Group** | Compare one segment's value against the values of peer segments with the same grouping dimensions. Best for detecting relative underperformance — e.g., one region declining while others hold steady. |
| **Period-over-Period** | Compare the current period against the same period in a prior cycle (last week, last month, last year). Best for seasonally adjusted metrics with predictable cycle patterns. |
 #### Detection mode
Choose how Prizm evaluates anomalies across grouping dimensions:
| Mode | Description |
| --------------- | -------------------------------------------------------------------------------------------------------------------------------------------------------------------------------------------------------------- |
| **Independent** | Each dimension combination is evaluated independently using its own time-series baseline. Use when segments behave differently and should be assessed on their own track record. |
| **Correlated** | Detects anomalies in how dimensions behave in relation to each other. Catches correlation breaks that are invisible when segments are assessed in isolation — e.g., revenue and volume diverging unexpectedly. |
#### Sensitivity
Control how aggressively Prizm flags deviations:
| Setting | Description |
| ---------- | --------------------------------------------------------------------------- |
| **Low** | Only flags large, obvious deviations — fewer alerts, higher confidence |
| **Medium** | Balanced detection — default for most use cases |
| **High** | Flags subtle deviations — more alerts, better coverage for critical metrics |
**Advanced sensitivity** allows explicit configuration of Z-score thresholds, percentage deviation bounds, and minimum sample size requirements.
#### Detection mode
Choose how Prizm evaluates anomalies across grouping dimensions:
| Mode | Description |
| --------------- | -------------------------------------------------------------------------------------------------------------------------------------------------------------------------------------------------------------- |
| **Independent** | Each dimension combination is evaluated independently using its own time-series baseline. Use when segments behave differently and should be assessed on their own track record. |
| **Correlated** | Detects anomalies in how dimensions behave in relation to each other. Catches correlation breaks that are invisible when segments are assessed in isolation — e.g., revenue and volume diverging unexpectedly. |
#### Sensitivity
Control how aggressively Prizm flags deviations:
| Setting | Description |
| ---------- | --------------------------------------------------------------------------- |
| **Low** | Only flags large, obvious deviations — fewer alerts, higher confidence |
| **Medium** | Balanced detection — default for most use cases |
| **High** | Flags subtle deviations — more alerts, better coverage for critical metrics |
**Advanced sensitivity** allows explicit configuration of Z-score thresholds, percentage deviation bounds, and minimum sample size requirements.
 Choose how Prizm determines when to raise an alert:
**Automated Threshold** — Prizm uses the adaptive baseline and configured sensitivity to determine the alert boundary automatically:
| Priority | Deviation range | Default |
| ------------ | --------------- | ---------------------------------- |
| **Low** | 0σ – 1σ | Off — within expected variation |
| **Medium** | 1σ – 2σ | Off — monitor for drift |
| **High** | 2σ – 3σ | **On** — investigation recommended |
| **Critical** | ≥ 3σ | **On** — immediate action required |
**Custom Threshold** — Set explicit upper and/or lower bounds on the aggregate value to trigger alerts.
Choose how Prizm determines when to raise an alert:
**Automated Threshold** — Prizm uses the adaptive baseline and configured sensitivity to determine the alert boundary automatically:
| Priority | Deviation range | Default |
| ------------ | --------------- | ---------------------------------- |
| **Low** | 0σ – 1σ | Off — within expected variation |
| **Medium** | 1σ – 2σ | Off — monitor for drift |
| **High** | 2σ – 3σ | **On** — investigation recommended |
| **Critical** | ≥ 3σ | **On** — immediate action required |
**Custom Threshold** — Set explicit upper and/or lower bounds on the aggregate value to trigger alerts.
 Scroll down past the Threshold section to complete:
* **Semantic context**: Assign Domain, Application, Product, Tag, and Dimension to make the metric discoverable and contextually relevant.
* **Owners**: Set Business owner, Technical owner, and Steward.
* **Audience**: Restrict who can view this metric's results.
Click **Save Changes** when done.
Scroll down past the Threshold section to complete:
* **Semantic context**: Assign Domain, Application, Product, Tag, and Dimension to make the metric discoverable and contextually relevant.
* **Owners**: Set Business owner, Technical owner, and Steward.
* **Audience**: Restrict who can view this metric's results.
Click **Save Changes** when done.