> ## Documentation Index
> Fetch the complete documentation index at: https://docs.dqlabs.ai/llms.txt
> Use this file to discover all available pages before exploring further.
# Setup
> Step-by-step guide to creating a Comparison metric in Prizm, including source selection, comparison mode, alignment, and thresholds.
## Creating a comparison metric
1. Navigate to **Metric** in the top navigation.
2. Click the **Add** button (⊕).
3. Enter a **Metric Name**.
4. Select **Subcategory: Comparison** from the dropdown.
5. Enter a **Purpose** description.
6. Click **Create**.
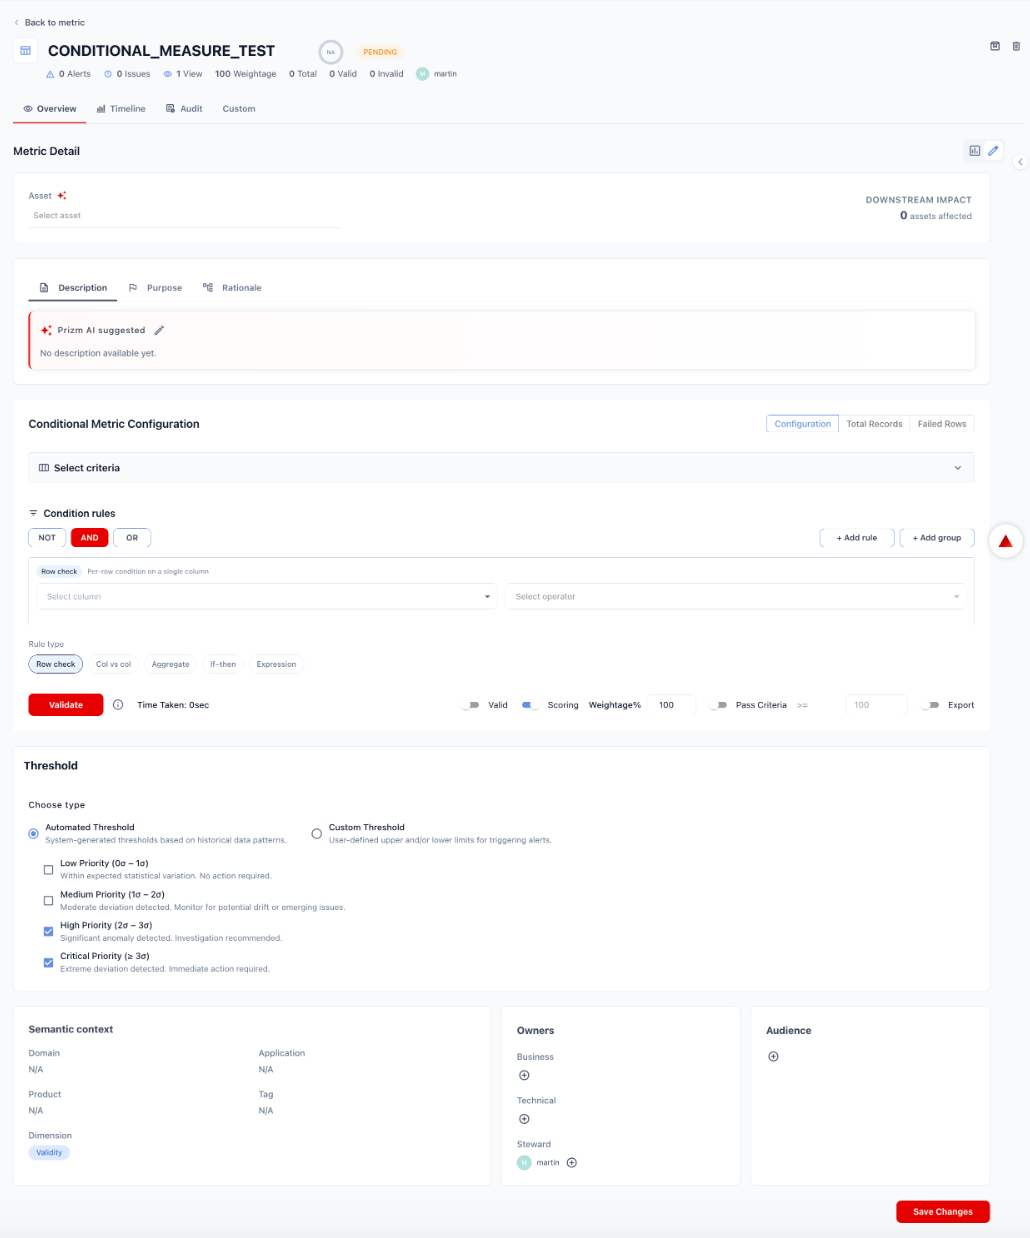 Click the metric name to open its detail page. The comparison metric configuration view exposes:
* **Source A** — the primary dataset
* **Source B** — the reference dataset
* **Metadata tabs** — Description, Purpose, Rationale
* **Comparison Metric Configuration** — comparison mode, alignment, metric expressions, and schema mapping
* **Threshold**
* **Semantic context** and **Owners**
Click the metric name to open its detail page. The comparison metric configuration view exposes:
* **Source A** — the primary dataset
* **Source B** — the reference dataset
* **Metadata tabs** — Description, Purpose, Rationale
* **Comparison Metric Configuration** — comparison mode, alignment, metric expressions, and schema mapping
* **Threshold**
* **Semantic context** and **Owners**
 Select the two datasets to compare. Each source is configured independently.
**Source A** is the primary dataset — typically the upstream or source-of-truth system. **Source B** is the reference dataset — the downstream target, replicated system, or transformed output.
For each source, select:
* **Connector** — the data source connection
* **Table / View** — the specific asset to query
| Field | Description |
| ---------------------- | ---------------------------------------------------- |
| **Source A connector** | The data source connection for the primary dataset |
| **Source A table** | The table or view to query for Source A |
| **Source B connector** | The data source connection for the reference dataset |
| **Source B table** | The table or view to query for Source B |
Source A and Source B do not need to use the same data platform. Cross-cloud comparisons (e.g., Snowflake vs. Databricks, or a dbt model output vs. a raw source table) are fully supported.
Select the two datasets to compare. Each source is configured independently.
**Source A** is the primary dataset — typically the upstream or source-of-truth system. **Source B** is the reference dataset — the downstream target, replicated system, or transformed output.
For each source, select:
* **Connector** — the data source connection
* **Table / View** — the specific asset to query
| Field | Description |
| ---------------------- | ---------------------------------------------------- |
| **Source A connector** | The data source connection for the primary dataset |
| **Source A table** | The table or view to query for Source A |
| **Source B connector** | The data source connection for the reference dataset |
| **Source B table** | The table or view to query for Source B |
Source A and Source B do not need to use the same data platform. Cross-cloud comparisons (e.g., Snowflake vs. Databricks, or a dbt model output vs. a raw source table) are fully supported.
 Select how Prizm compares the two sources:
| Mode | Description | Best for |
| ------------------------ | ----------------------------------------------------------------------------------------------------------------------------------------- | --------------------------------------------------------------------- |
| **Metric-to-Metric** | Computes an aggregate value (count, sum, average) from each source and compares the two values. The simplest and most common mode. | Row count checks, SUM reconciliation, aggregate validation |
| **Profile-to-Profile** | Compares dataset-level profile statistics between the two sources — null %, distinct count, min/max, mean, stddev, and top-k frequencies. | Detecting distribution drift, migration QA without row-level access |
| **Row/Value-Level Diff** | Compares the two tables row-by-row using configured key columns and evaluates target columns for per-record mismatches. | Deep reconciliation, migration integrity validation, CDC verification |
Select how Prizm compares the two sources:
| Mode | Description | Best for |
| ------------------------ | ----------------------------------------------------------------------------------------------------------------------------------------- | --------------------------------------------------------------------- |
| **Metric-to-Metric** | Computes an aggregate value (count, sum, average) from each source and compares the two values. The simplest and most common mode. | Row count checks, SUM reconciliation, aggregate validation |
| **Profile-to-Profile** | Compares dataset-level profile statistics between the two sources — null %, distinct count, min/max, mean, stddev, and top-k frequencies. | Detecting distribution drift, migration QA without row-level access |
| **Row/Value-Level Diff** | Compares the two tables row-by-row using configured key columns and evaluates target columns for per-record mismatches. | Deep reconciliation, migration integrity validation, CDC verification |
 #### Time and partition alignment
Configure how records are aligned between the two sources before comparison. Misalignment (e.g., comparing a stale target against a fresh source) causes false positives.
| Alignment option | Description |
| ------------------------------- | ------------------------------------------------------------- |
| **By time window** | Align records by a shared event time or business date column |
| **By ingestion batch / run ID** | Align by the batch identifier used during loading |
| **By partition column** | Align by a partition key (e.g., `date`, `region`, `batch_id`) |
Prizm includes a **freshness gate** — if the target source has not been updated within the expected window, the comparison is skipped and no alert is raised, preventing stale-data false positives.
#### Schema mapping
For Profile-to-Profile and Row/Value-Level Diff modes, map columns between the two sources:
| Option | Description |
| ------------------ | ------------------------------------------------------------------------------------------------- |
| **Auto-suggest** | Prizm matches columns by name similarity and type compatibility — confirm or override suggestions |
| **Manual mapping** | Manually pair source and reference columns |
| **Ignore columns** | Mark columns as out of scope (e.g., internal timestamps, surrogate keys) |
#### Time and partition alignment
Configure how records are aligned between the two sources before comparison. Misalignment (e.g., comparing a stale target against a fresh source) causes false positives.
| Alignment option | Description |
| ------------------------------- | ------------------------------------------------------------- |
| **By time window** | Align records by a shared event time or business date column |
| **By ingestion batch / run ID** | Align by the batch identifier used during loading |
| **By partition column** | Align by a partition key (e.g., `date`, `region`, `batch_id`) |
Prizm includes a **freshness gate** — if the target source has not been updated within the expected window, the comparison is skipped and no alert is raised, preventing stale-data false positives.
#### Schema mapping
For Profile-to-Profile and Row/Value-Level Diff modes, map columns between the two sources:
| Option | Description |
| ------------------ | ------------------------------------------------------------------------------------------------- |
| **Auto-suggest** | Prizm matches columns by name similarity and type compatibility — confirm or override suggestions |
| **Manual mapping** | Manually pair source and reference columns |
| **Ignore columns** | Mark columns as out of scope (e.g., internal timestamps, surrogate keys) |
 For **Metric-to-Metric** mode, define the metric value to compute from each source and how to evaluate the difference.
#### Aggregate expressions
Write the aggregate expression for each source. Common templates:
| Template | Expression | Use case |
| -------------- | ----------------------------- | ---------------------------------------- |
| Row count | `COUNT(*)` | Verify total record counts match |
| Sum of column | `SUM(amount)` | Verify totals match after transformation |
| Distinct count | `COUNT(DISTINCT customer_id)` | Verify unique entity counts |
| Average | `AVG(order_value)` | Verify mean values are consistent |
Prizm AI can **auto-suggest** appropriate expressions based on the metric name, purpose, and the schemas of both sources.
#### Comparison formula
Choose how to evaluate the difference between the two computed values:
| Formula | Expression | Description |
| ----------------- | ------------------------ | -------------------------------------------------- |
| **Absolute diff** | `A − B` | Raw difference between the two values |
| **Percent diff** | `(A − B) / B × 100` | Percentage deviation of A from B |
| **Ratio** | `A / B` | Ratio of A to B (1.0 = perfect match) |
| **Bounded ratio** | `A / B ∈ [lower, upper]` | Pass only if the ratio falls within a defined band |
| **Directional** | `A >= B` | Assert that A is always greater than or equal to B |
#### Rule options
| Option | Description |
| ----------------- | ------------------------------------------------------------------ |
| **Valid** | Treat a result within the pass criteria as valid |
| **Scoring** | Include this metric in the asset quality score |
| **Weightage%** | Relative weight of this metric in the overall score (default 100) |
| **Pass Criteria** | The condition the result must satisfy to pass (e.g., `Diff% <= 1`) |
| **Export** | Include metric results in data exports |
Click **Validate** to run a sample comparison and preview the A value, B value, and computed difference before saving.
For **Metric-to-Metric** mode, define the metric value to compute from each source and how to evaluate the difference.
#### Aggregate expressions
Write the aggregate expression for each source. Common templates:
| Template | Expression | Use case |
| -------------- | ----------------------------- | ---------------------------------------- |
| Row count | `COUNT(*)` | Verify total record counts match |
| Sum of column | `SUM(amount)` | Verify totals match after transformation |
| Distinct count | `COUNT(DISTINCT customer_id)` | Verify unique entity counts |
| Average | `AVG(order_value)` | Verify mean values are consistent |
Prizm AI can **auto-suggest** appropriate expressions based on the metric name, purpose, and the schemas of both sources.
#### Comparison formula
Choose how to evaluate the difference between the two computed values:
| Formula | Expression | Description |
| ----------------- | ------------------------ | -------------------------------------------------- |
| **Absolute diff** | `A − B` | Raw difference between the two values |
| **Percent diff** | `(A − B) / B × 100` | Percentage deviation of A from B |
| **Ratio** | `A / B` | Ratio of A to B (1.0 = perfect match) |
| **Bounded ratio** | `A / B ∈ [lower, upper]` | Pass only if the ratio falls within a defined band |
| **Directional** | `A >= B` | Assert that A is always greater than or equal to B |
#### Rule options
| Option | Description |
| ----------------- | ------------------------------------------------------------------ |
| **Valid** | Treat a result within the pass criteria as valid |
| **Scoring** | Include this metric in the asset quality score |
| **Weightage%** | Relative weight of this metric in the overall score (default 100) |
| **Pass Criteria** | The condition the result must satisfy to pass (e.g., `Diff% <= 1`) |
| **Export** | Include metric results in data exports |
Click **Validate** to run a sample comparison and preview the A value, B value, and computed difference before saving.
 Choose how Prizm determines when to raise an alert on the comparison result:
**Automated Threshold** — Prizm learns statistical baselines from historical deviation values and alerts when the result deviates by a configurable number of standard deviations:
| Priority | Deviation range | Default |
| ------------ | --------------- | ---------------------------------- |
| **Low** | 0σ – 1σ | Off — within expected variation |
| **Medium** | 1σ – 2σ | Off — monitor for drift |
| **High** | 2σ – 3σ | **On** — investigation recommended |
| **Critical** | ≥ 3σ | **On** — immediate action required |
**Custom Threshold** — Set explicit tolerance bounds:
| Threshold type | Description | | | | |
| ----------------- | ----------------------------------------------------------- | ----- | ----- | - | ------ |
| **Absolute diff** | Alert when \` | A − B | > X\` | | |
| **Percent diff** | Alert when \` | A − B | / | B | > P%\` |
| **Ratio band** | Alert when `A / B` falls outside the range `[lower, upper]` | | | | |
**Noise guards** prevent false positives:
| Guard | Description |
| ----------------------- | ------------------------------------------------------------------------------------- |
| **Minimum volume gate** | Skip alert when record counts are below a minimum threshold |
| **Freshness gate** | Skip alert when the target source has not been updated within the expected window |
| **Persistence rule** | Only alert if the deviation occurs in 2 of the last 3 runs (reduces transient spikes) |
Choose how Prizm determines when to raise an alert on the comparison result:
**Automated Threshold** — Prizm learns statistical baselines from historical deviation values and alerts when the result deviates by a configurable number of standard deviations:
| Priority | Deviation range | Default |
| ------------ | --------------- | ---------------------------------- |
| **Low** | 0σ – 1σ | Off — within expected variation |
| **Medium** | 1σ – 2σ | Off — monitor for drift |
| **High** | 2σ – 3σ | **On** — investigation recommended |
| **Critical** | ≥ 3σ | **On** — immediate action required |
**Custom Threshold** — Set explicit tolerance bounds:
| Threshold type | Description | | | | |
| ----------------- | ----------------------------------------------------------- | ----- | ----- | - | ------ |
| **Absolute diff** | Alert when \` | A − B | > X\` | | |
| **Percent diff** | Alert when \` | A − B | / | B | > P%\` |
| **Ratio band** | Alert when `A / B` falls outside the range `[lower, upper]` | | | | |
**Noise guards** prevent false positives:
| Guard | Description |
| ----------------------- | ------------------------------------------------------------------------------------- |
| **Minimum volume gate** | Skip alert when record counts are below a minimum threshold |
| **Freshness gate** | Skip alert when the target source has not been updated within the expected window |
| **Persistence rule** | Only alert if the deviation occurs in 2 of the last 3 runs (reduces transient spikes) |
 Scroll down past the Threshold section to complete:
* **Semantic context**: Assign Domain, Application, Product, Tag, and Dimension to make the metric discoverable and contextually relevant.
* **Owners**: Set Business owner, Technical owner, and Steward.
* **Audience**: Restrict who can view this metric's results.
Click **Save Changes** when done.
Scroll down past the Threshold section to complete:
* **Semantic context**: Assign Domain, Application, Product, Tag, and Dimension to make the metric discoverable and contextually relevant.
* **Owners**: Set Business owner, Technical owner, and Steward.
* **Audience**: Restrict who can view this metric's results.
Click **Save Changes** when done.