> ## Documentation Index
> Fetch the complete documentation index at: https://docs.dqlabs.ai/llms.txt
> Use this file to discover all available pages before exploring further.
# Configure
> How to enable and configure Prizm's Pattern metrics per column, including short and long pattern detection and thresholds.
## Configuring Pattern metrics
Pattern metrics are enabled per column through the Configure Structural Metrics panel. Once active, thresholds and settings are managed on the asset's Metric tab.
1. Navigate to **Metric** in the top navigation.
2. Click **Configure Structural Metrics** (the waveform icon in the toolbar).
3. In the **Map Asset/Attributes to the Metrics** search field, select the target asset and column.
4. Click the **Pattern** tab and check **Short Pattern**, **Long Pattern**, or both.
5. Click **Apply**.
On the next profiling run, Prizm auto-discovers the baseline pattern from the column's existing values. No manual pattern specification is required. To adjust thresholds, navigate to **Asset** → open the asset → **Metric** tab → **PATTERN** filter chip → click the metric → **Edit configuration** (pencil icon).
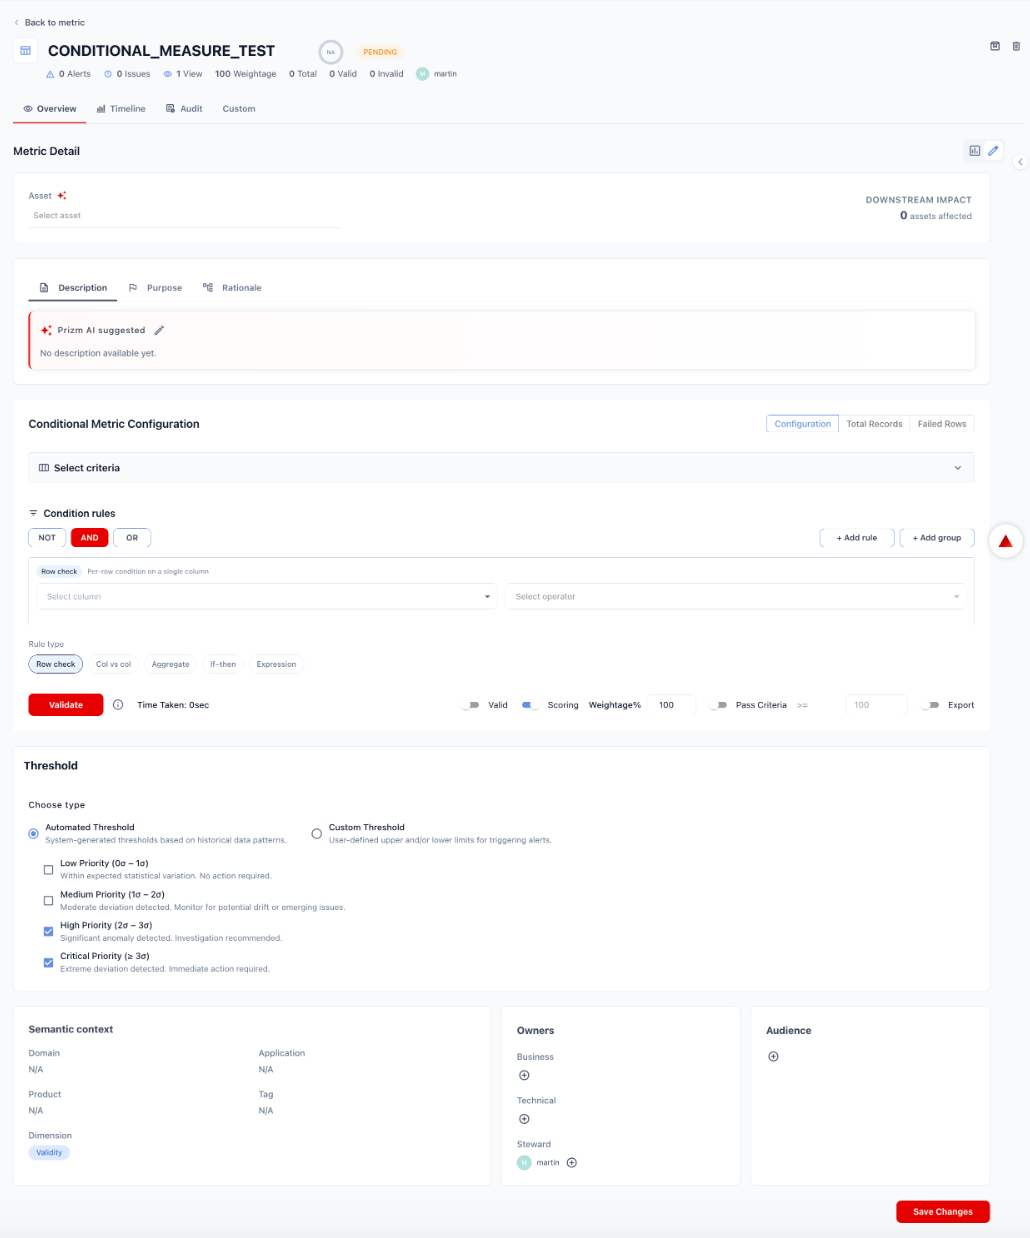 ## Configuration options
| Option | Description |
| ----------------- | ----------------------------------------------------------------- |
| **Valid** | Whether a result within the pass criteria counts as a valid run |
| **Scoring** | Include this metric in the asset's overall quality score |
| **Weightage%** | Relative weight of this metric in the overall score (default 100) |
| **Pass Criteria** | The condition the result must satisfy to pass (default `>= 100`) |
| **Export** | Include metric results in data exports |
## Threshold
Choose how Prizm determines when to raise a Pattern alert.
**Automated Threshold** — System-generated thresholds based on the historical pattern distribution for the column. Prizm computes how many standard deviations the current pattern distribution is from the baseline and maps deviation magnitude to alert priority:
| Priority | Deviation | Default | Description |
| ------------ | --------- | ------- | ------------------------------------------------------------------- |
| **Low** | 0σ – 1σ | Off | Within expected variation. No action required. |
| **Medium** | 1σ – 2σ | Off | Moderate pattern shift detected. Monitor for emerging changes. |
| **High** | 2σ – 3σ | **On** | Significant format anomaly. Investigation recommended. |
| **Critical** | ≥ 3σ | **On** | Extreme deviation from baseline pattern. Immediate action required. |
**Custom Threshold** — User-defined tolerance for the proportion of values allowed to match non-baseline patterns before an alert fires. For example, alert if more than 2% of values in a column deviate from the established format.
## Semantic context
Pattern metrics are automatically tagged with:
* **Dimension:** Validity
* **Domain:** Inherited from the asset's domain assignment
To update the semantic context or assign Owners, open the metric in Edit configuration mode and scroll to the **Semantic context** and **Owners** sections.
## Configuration options
| Option | Description |
| ----------------- | ----------------------------------------------------------------- |
| **Valid** | Whether a result within the pass criteria counts as a valid run |
| **Scoring** | Include this metric in the asset's overall quality score |
| **Weightage%** | Relative weight of this metric in the overall score (default 100) |
| **Pass Criteria** | The condition the result must satisfy to pass (default `>= 100`) |
| **Export** | Include metric results in data exports |
## Threshold
Choose how Prizm determines when to raise a Pattern alert.
**Automated Threshold** — System-generated thresholds based on the historical pattern distribution for the column. Prizm computes how many standard deviations the current pattern distribution is from the baseline and maps deviation magnitude to alert priority:
| Priority | Deviation | Default | Description |
| ------------ | --------- | ------- | ------------------------------------------------------------------- |
| **Low** | 0σ – 1σ | Off | Within expected variation. No action required. |
| **Medium** | 1σ – 2σ | Off | Moderate pattern shift detected. Monitor for emerging changes. |
| **High** | 2σ – 3σ | **On** | Significant format anomaly. Investigation recommended. |
| **Critical** | ≥ 3σ | **On** | Extreme deviation from baseline pattern. Immediate action required. |
**Custom Threshold** — User-defined tolerance for the proportion of values allowed to match non-baseline patterns before an alert fires. For example, alert if more than 2% of values in a column deviate from the established format.
## Semantic context
Pattern metrics are automatically tagged with:
* **Dimension:** Validity
* **Domain:** Inherited from the asset's domain assignment
To update the semantic context or assign Owners, open the metric in Edit configuration mode and scroll to the **Semantic context** and **Owners** sections.