> ## Documentation Index
> Fetch the complete documentation index at: https://docs.dqlabs.ai/llms.txt
> Use this file to discover all available pages before exploring further.
# Setup
> Step-by-step instructions for creating a Query metric and adding runtime parameters.
## Creating a query metric
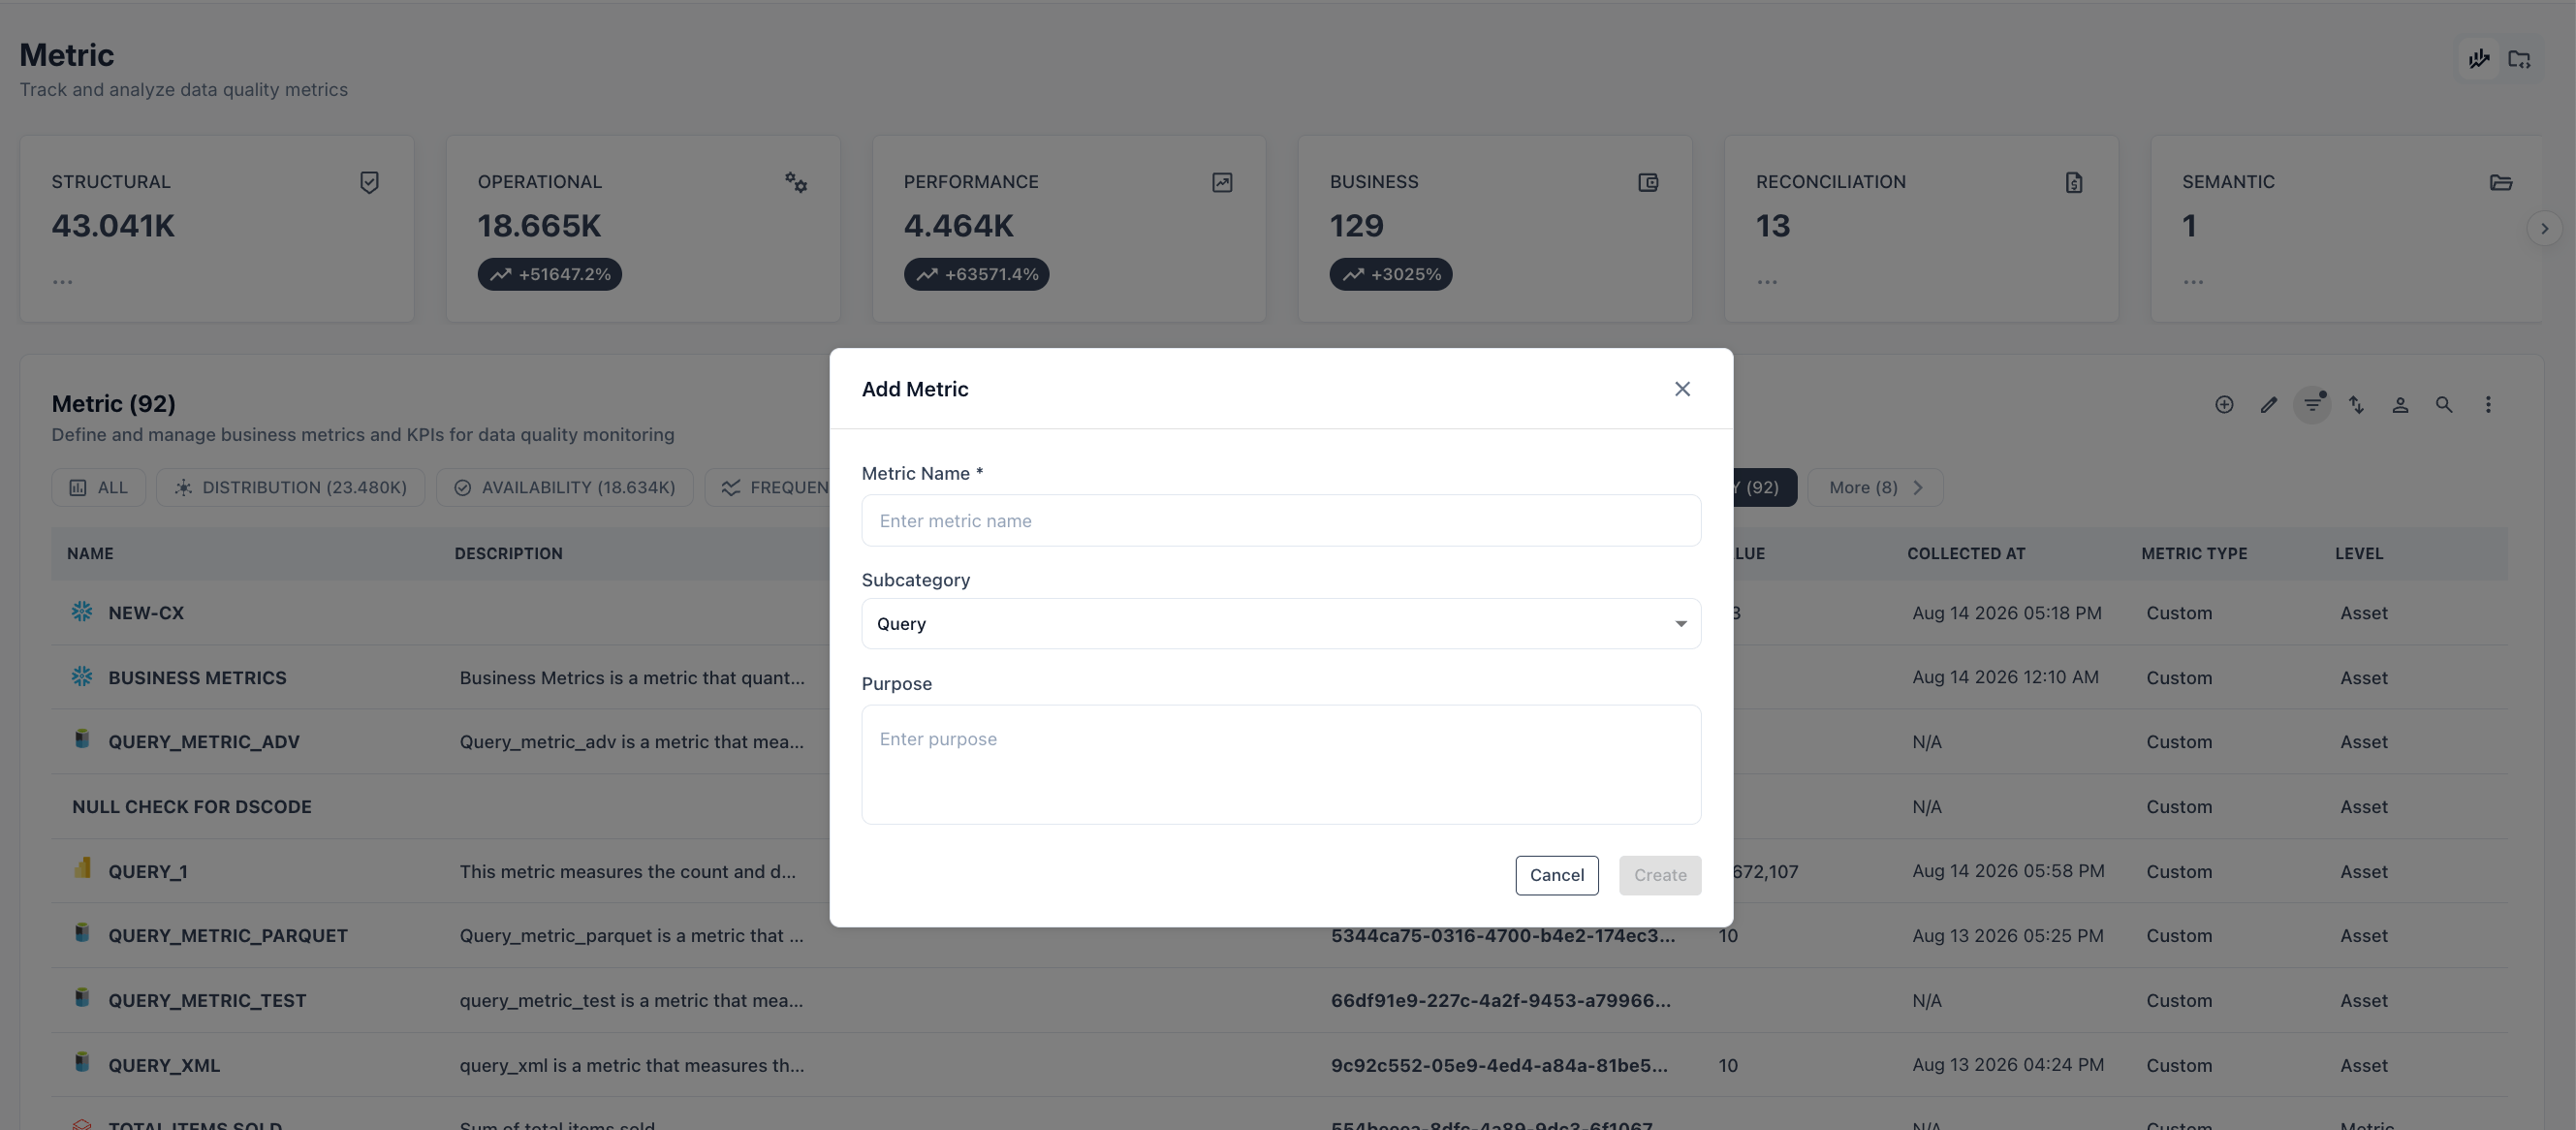
1. Navigate to **Metric** in the top navigation.
2. Click the **Add** button (⊕).
3. Enter a **Metric Name**.
4. Select **Subcategory: Query** from the dropdown.
5. Enter a **Purpose** description.
6. Click **Create**.
 Click the metric name to open its detail page. The configuration view exposes:
* **Asset** — the table or view the metric runs against
* **Metadata tabs** — Description, Purpose, Rationale
* **Query Metric Configuration** — SQL editor and rule options
* **Threshold**
* **Semantic context** and **Owners**
Click the metric name to open its detail page. The configuration view exposes:
* **Asset** — the table or view the metric runs against
* **Metadata tabs** — Description, Purpose, Rationale
* **Query Metric Configuration** — SQL editor and rule options
* **Threshold**
* **Semantic context** and **Owners**
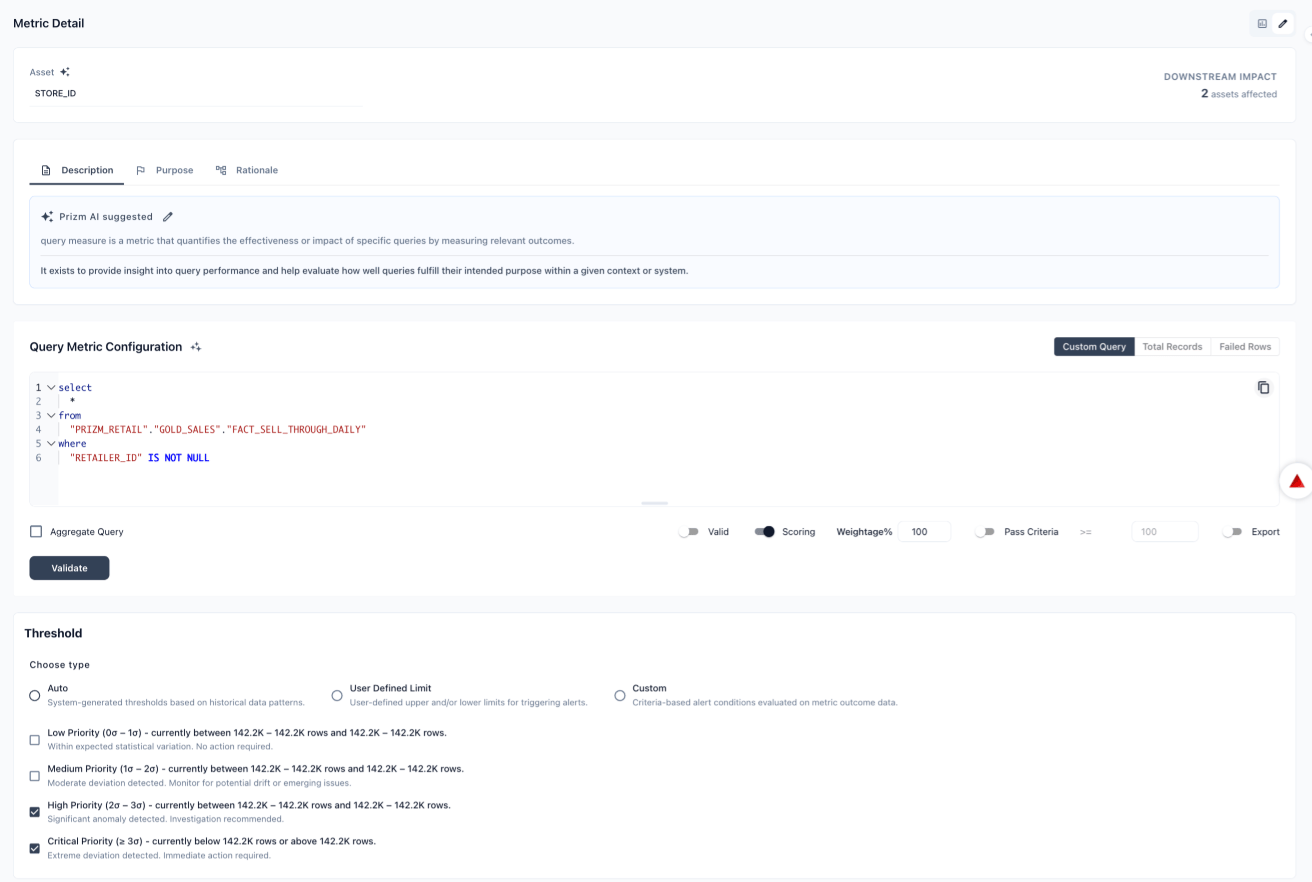 **Asset:** Select the table or view this metric will query. Use the **AI-assisted asset selection** button to let Prizm suggest an asset based on the metric name and purpose.
The **Downstream Impact** counter shows how many other assets depend on this asset.
**Asset:** Select the table or view this metric will query. Use the **AI-assisted asset selection** button to let Prizm suggest an asset based on the metric name and purpose.
The **Downstream Impact** counter shows how many other assets depend on this asset.
 Fill in the metadata tabs as needed:
| Tab | Content |
| --------------- | --------------------------------------------------------------------------------------- |
| **Description** | What this metric measures. Prizm AI can suggest a description based on the metric name. |
| **Purpose** | Business justification — why this metric exists. |
| **Rationale** | The reasoning behind the specific SQL query chosen. |
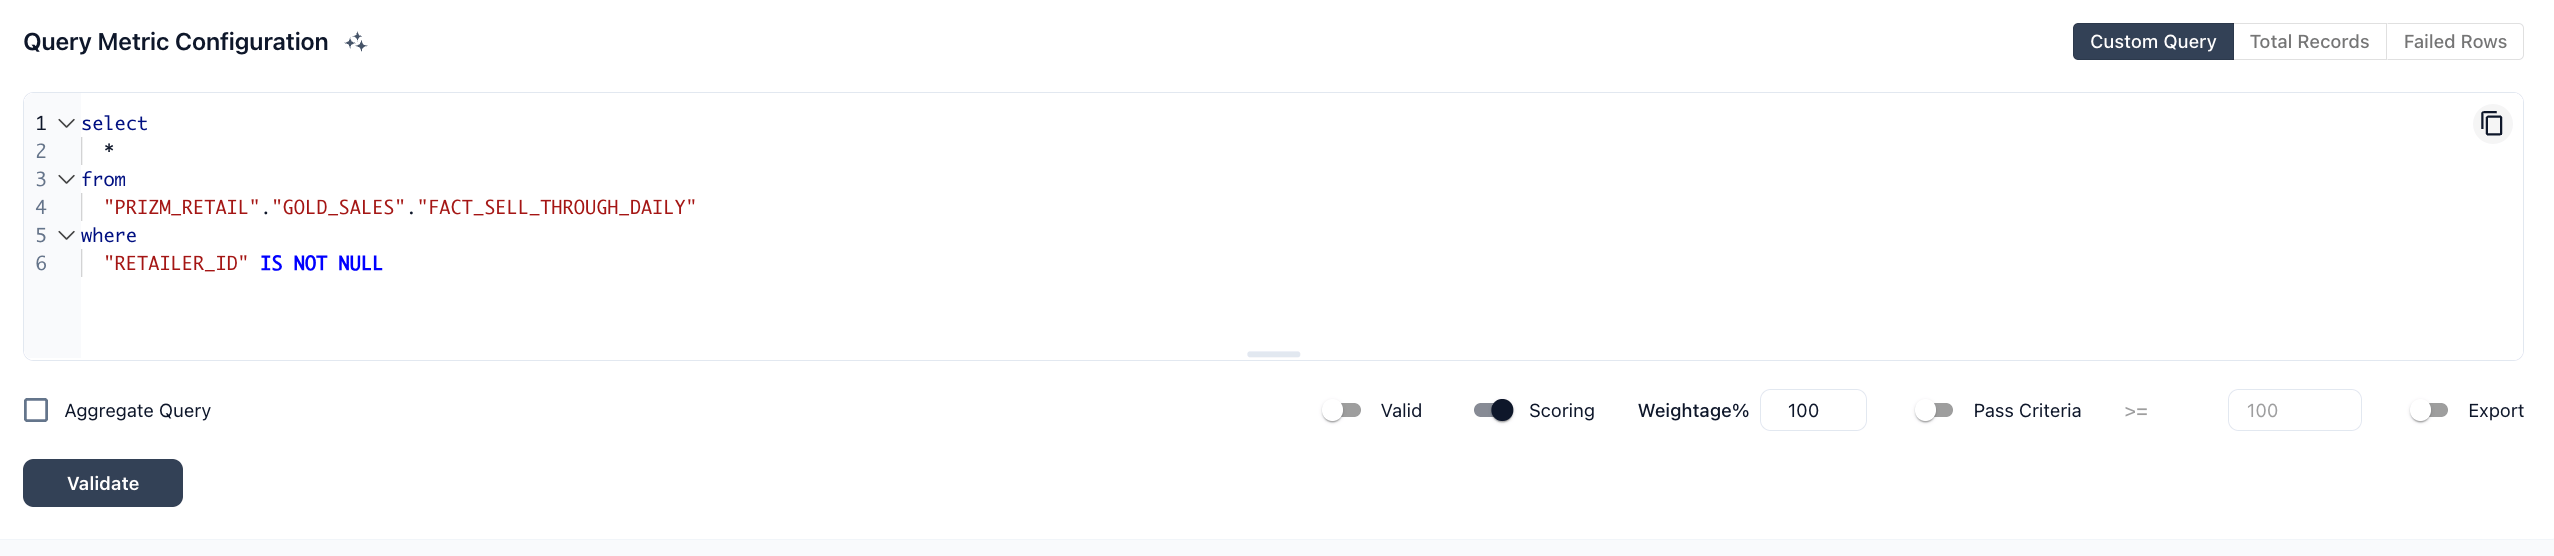
The **Configuration** tab contains the SQL editor where you define the metric logic.
Write a SQL `SELECT` statement that returns a **single numeric value**. The returned number is the metric value recorded on each run.
```sql theme={null}
-- Example: count of records violating a business rule
SELECT COUNT(*)
FROM orders
WHERE order_total < 0
AND order_status = 'completed'
```
#### Rule options
| Option | Description |
| ----------------- | ------------------------------------------------------------------------------- |
| **Valid** | Treat a non-zero result as the signal to evaluate |
| **Scoring** | Include this metric in the asset quality score |
| **Weightage%** | Relative weight of this metric in the overall score (default 100) |
| **Pass Criteria** | The threshold condition the result must satisfy to pass (e.g., `= 0`, `<= 100`) |
| **Export** | Include metric results in data exports |
Click **Validate** to execute the query against current data and preview the returned value. Click **View prepared query** to inspect the full SQL Prizm will execute.
Fill in the metadata tabs as needed:
| Tab | Content |
| --------------- | --------------------------------------------------------------------------------------- |
| **Description** | What this metric measures. Prizm AI can suggest a description based on the metric name. |
| **Purpose** | Business justification — why this metric exists. |
| **Rationale** | The reasoning behind the specific SQL query chosen. |
The **Configuration** tab contains the SQL editor where you define the metric logic.
Write a SQL `SELECT` statement that returns a **single numeric value**. The returned number is the metric value recorded on each run.
```sql theme={null}
-- Example: count of records violating a business rule
SELECT COUNT(*)
FROM orders
WHERE order_total < 0
AND order_status = 'completed'
```
#### Rule options
| Option | Description |
| ----------------- | ------------------------------------------------------------------------------- |
| **Valid** | Treat a non-zero result as the signal to evaluate |
| **Scoring** | Include this metric in the asset quality score |
| **Weightage%** | Relative weight of this metric in the overall score (default 100) |
| **Pass Criteria** | The threshold condition the result must satisfy to pass (e.g., `= 0`, `<= 100`) |
| **Export** | Include metric results in data exports |
Click **Validate** to execute the query against current data and preview the returned value. Click **View prepared query** to inspect the full SQL Prizm will execute.
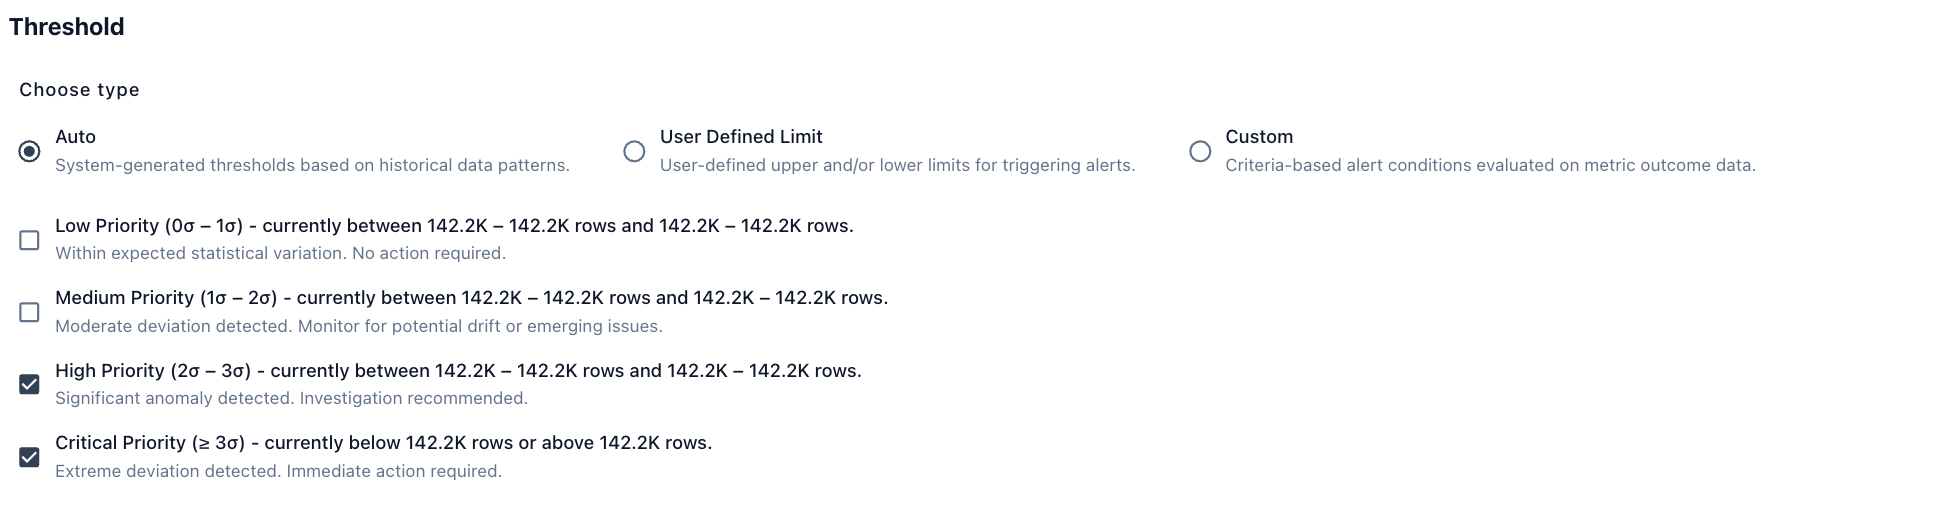
 Choose how Prizm determines when to raise an alert on the query result:
**Automated Threshold** — Prizm learns statistical baselines from historical run values and alerts when the result deviates by a configurable number of standard deviations:
| Priority | Deviation range | Default |
| ------------ | --------------- | ---------------------------------- |
| **Low** | 0σ – 1σ | Off — within expected variation |
| **Medium** | 1σ – 2σ | Off — monitor for drift |
| **High** | 2σ – 3σ | **On** — investigation recommended |
| **Critical** | ≥ 3σ | **On** — immediate action required |
**Custom Threshold** — Set explicit upper and/or lower bounds on the query result to trigger alerts (e.g., alert if result `> 0` for a zero-tolerance rule, or alert if ratio `> 0.01` for a 1% tolerance rule).
Choose how Prizm determines when to raise an alert on the query result:
**Automated Threshold** — Prizm learns statistical baselines from historical run values and alerts when the result deviates by a configurable number of standard deviations:
| Priority | Deviation range | Default |
| ------------ | --------------- | ---------------------------------- |
| **Low** | 0σ – 1σ | Off — within expected variation |
| **Medium** | 1σ – 2σ | Off — monitor for drift |
| **High** | 2σ – 3σ | **On** — investigation recommended |
| **Critical** | ≥ 3σ | **On** — immediate action required |
**Custom Threshold** — Set explicit upper and/or lower bounds on the query result to trigger alerts (e.g., alert if result `> 0` for a zero-tolerance rule, or alert if ratio `> 0.01` for a 1% tolerance rule).
 Scroll down past the Threshold section to complete:
* **Semantic context**: Assign Domain, Application, Product, Tag, and Dimension to make the metric discoverable and contextually relevant.
* **Owners**: Set Business owner, Technical owner, and Steward.
* **Audience**: Restrict who can view this metric's results.
Click **Save Changes** when done.
Scroll down past the Threshold section to complete:
* **Semantic context**: Assign Domain, Application, Product, Tag, and Dimension to make the metric discoverable and contextually relevant.
* **Owners**: Set Business owner, Technical owner, and Steward.
* **Audience**: Restrict who can view this metric's results.
Click **Save Changes** when done.
 ***
## Adding parameters to your query
Any query metric can accept runtime input by placing `{{param_name}}` tokens directly in the SQL. Prizm auto-detects every token when you save the metric and adds it to the parameter list — no separate declaration step needed.
```sql theme={null}
-- Fixed query
SELECT COUNT(*) FROM orders WHERE status = 'failed'
-- Parameterized — value supplied at run time
SELECT COUNT(*) FROM orders
WHERE status = 'failed'
AND business_date >= {{start_date}}
AND region = {{region}}
```
### Step 1 — Write the SQL with `{{param_name}}` tokens
Place a `{{param_name}}` token anywhere a value should be injected. The token name becomes the field label in the run-time popup. Rules:
* Tokens are case-sensitive: `{{Region}}` and `{{region}}` are different parameters.
* The same token can appear multiple times — all occurrences resolve to the same value.
* SOURCE tokens (`{{table}}`, `{{schema}}`, `{{database}}`, `{{attribute}}`, `{{connection}}`, `{{warehouse}}`, `{{account}}`, `{{region}}`) resolve automatically from the connected asset — they do not appear in the popup.
### Step 2 — Save and review detected parameters
Click **Save Changes**. Prizm scans the SQL and displays the detected parameters below the editor. For each parameter, configure:
| Field | Description |
| ------------- | -------------------------------------------------------------------------------------------------------------------------------- |
| **Category** | `SOURCE` — auto-resolved from asset \| `CONSTANT` — from org-level Settings → Parameters \| `METADATA` — from the metadata graph |
| **Type** | `string`, `date`, `number`, `enum` |
| **Required** | Toggle on — execution is blocked until a value is provided |
| **Default** | Value used when the caller does not supply one |
| **Allowlist** | Comma-separated permitted values (ENUM type only) |
### Step 3 — Run the metric and supply values in the popup
When you click **Run** on a parameterized metric, Prizm opens a **parameter input popup** before executing. The popup lists every non-SOURCE parameter that needs a value:
* Parameters with a **default** show the default value pre-filled — you can accept it or override it.
* Parameters marked **Required** with no default must be filled before the Run button activates.
* ENUM parameters show a dropdown of allowed values.
* DATE parameters show a date picker.
Fill in the fields and click **Run**. Prizm validates the inputs, renders the SQL with the resolved values, and executes it. The resolved SQL and effective parameter values are stored in the audit record for this run.
Each run with different parameter values is a separate result entry — you can re-run the same metric for different date ranges, regions, or thresholds without creating multiple metric definitions.
### Running via API
```http theme={null}
POST /api/v1/measures/{measure_id}/run
Content-Type: application/json
{
"parameters": {
"start_date": "2026-01-01",
"region": "NA",
"min_count": 500
}
}
```
### Running via CLI
```bash theme={null}
dqlabs measures run --id \
--param start_date=2026-01-01 \
--param region=NA \
--param min_count=500 \
--output json
```
### Parameter resolution priority
When the same parameter has values at multiple levels, the following priority applies:
```text theme={null}
Caller-supplied value (popup / API / CLI)
> Metric-level default
> Validation error (if required and no value found)
```
***
## Adding parameters to your query
Any query metric can accept runtime input by placing `{{param_name}}` tokens directly in the SQL. Prizm auto-detects every token when you save the metric and adds it to the parameter list — no separate declaration step needed.
```sql theme={null}
-- Fixed query
SELECT COUNT(*) FROM orders WHERE status = 'failed'
-- Parameterized — value supplied at run time
SELECT COUNT(*) FROM orders
WHERE status = 'failed'
AND business_date >= {{start_date}}
AND region = {{region}}
```
### Step 1 — Write the SQL with `{{param_name}}` tokens
Place a `{{param_name}}` token anywhere a value should be injected. The token name becomes the field label in the run-time popup. Rules:
* Tokens are case-sensitive: `{{Region}}` and `{{region}}` are different parameters.
* The same token can appear multiple times — all occurrences resolve to the same value.
* SOURCE tokens (`{{table}}`, `{{schema}}`, `{{database}}`, `{{attribute}}`, `{{connection}}`, `{{warehouse}}`, `{{account}}`, `{{region}}`) resolve automatically from the connected asset — they do not appear in the popup.
### Step 2 — Save and review detected parameters
Click **Save Changes**. Prizm scans the SQL and displays the detected parameters below the editor. For each parameter, configure:
| Field | Description |
| ------------- | -------------------------------------------------------------------------------------------------------------------------------- |
| **Category** | `SOURCE` — auto-resolved from asset \| `CONSTANT` — from org-level Settings → Parameters \| `METADATA` — from the metadata graph |
| **Type** | `string`, `date`, `number`, `enum` |
| **Required** | Toggle on — execution is blocked until a value is provided |
| **Default** | Value used when the caller does not supply one |
| **Allowlist** | Comma-separated permitted values (ENUM type only) |
### Step 3 — Run the metric and supply values in the popup
When you click **Run** on a parameterized metric, Prizm opens a **parameter input popup** before executing. The popup lists every non-SOURCE parameter that needs a value:
* Parameters with a **default** show the default value pre-filled — you can accept it or override it.
* Parameters marked **Required** with no default must be filled before the Run button activates.
* ENUM parameters show a dropdown of allowed values.
* DATE parameters show a date picker.
Fill in the fields and click **Run**. Prizm validates the inputs, renders the SQL with the resolved values, and executes it. The resolved SQL and effective parameter values are stored in the audit record for this run.
Each run with different parameter values is a separate result entry — you can re-run the same metric for different date ranges, regions, or thresholds without creating multiple metric definitions.
### Running via API
```http theme={null}
POST /api/v1/measures/{measure_id}/run
Content-Type: application/json
{
"parameters": {
"start_date": "2026-01-01",
"region": "NA",
"min_count": 500
}
}
```
### Running via CLI
```bash theme={null}
dqlabs measures run --id \
--param start_date=2026-01-01 \
--param region=NA \
--param min_count=500 \
--output json
```
### Parameter resolution priority
When the same parameter has values at multiple levels, the following priority applies:
```text theme={null}
Caller-supplied value (popup / API / CLI)
> Metric-level default
> Validation error (if required and no value found)
```