> ## Documentation Index
> Fetch the complete documentation index at: https://docs.dqlabs.ai/llms.txt
> Use this file to discover all available pages before exploring further.
# Configure
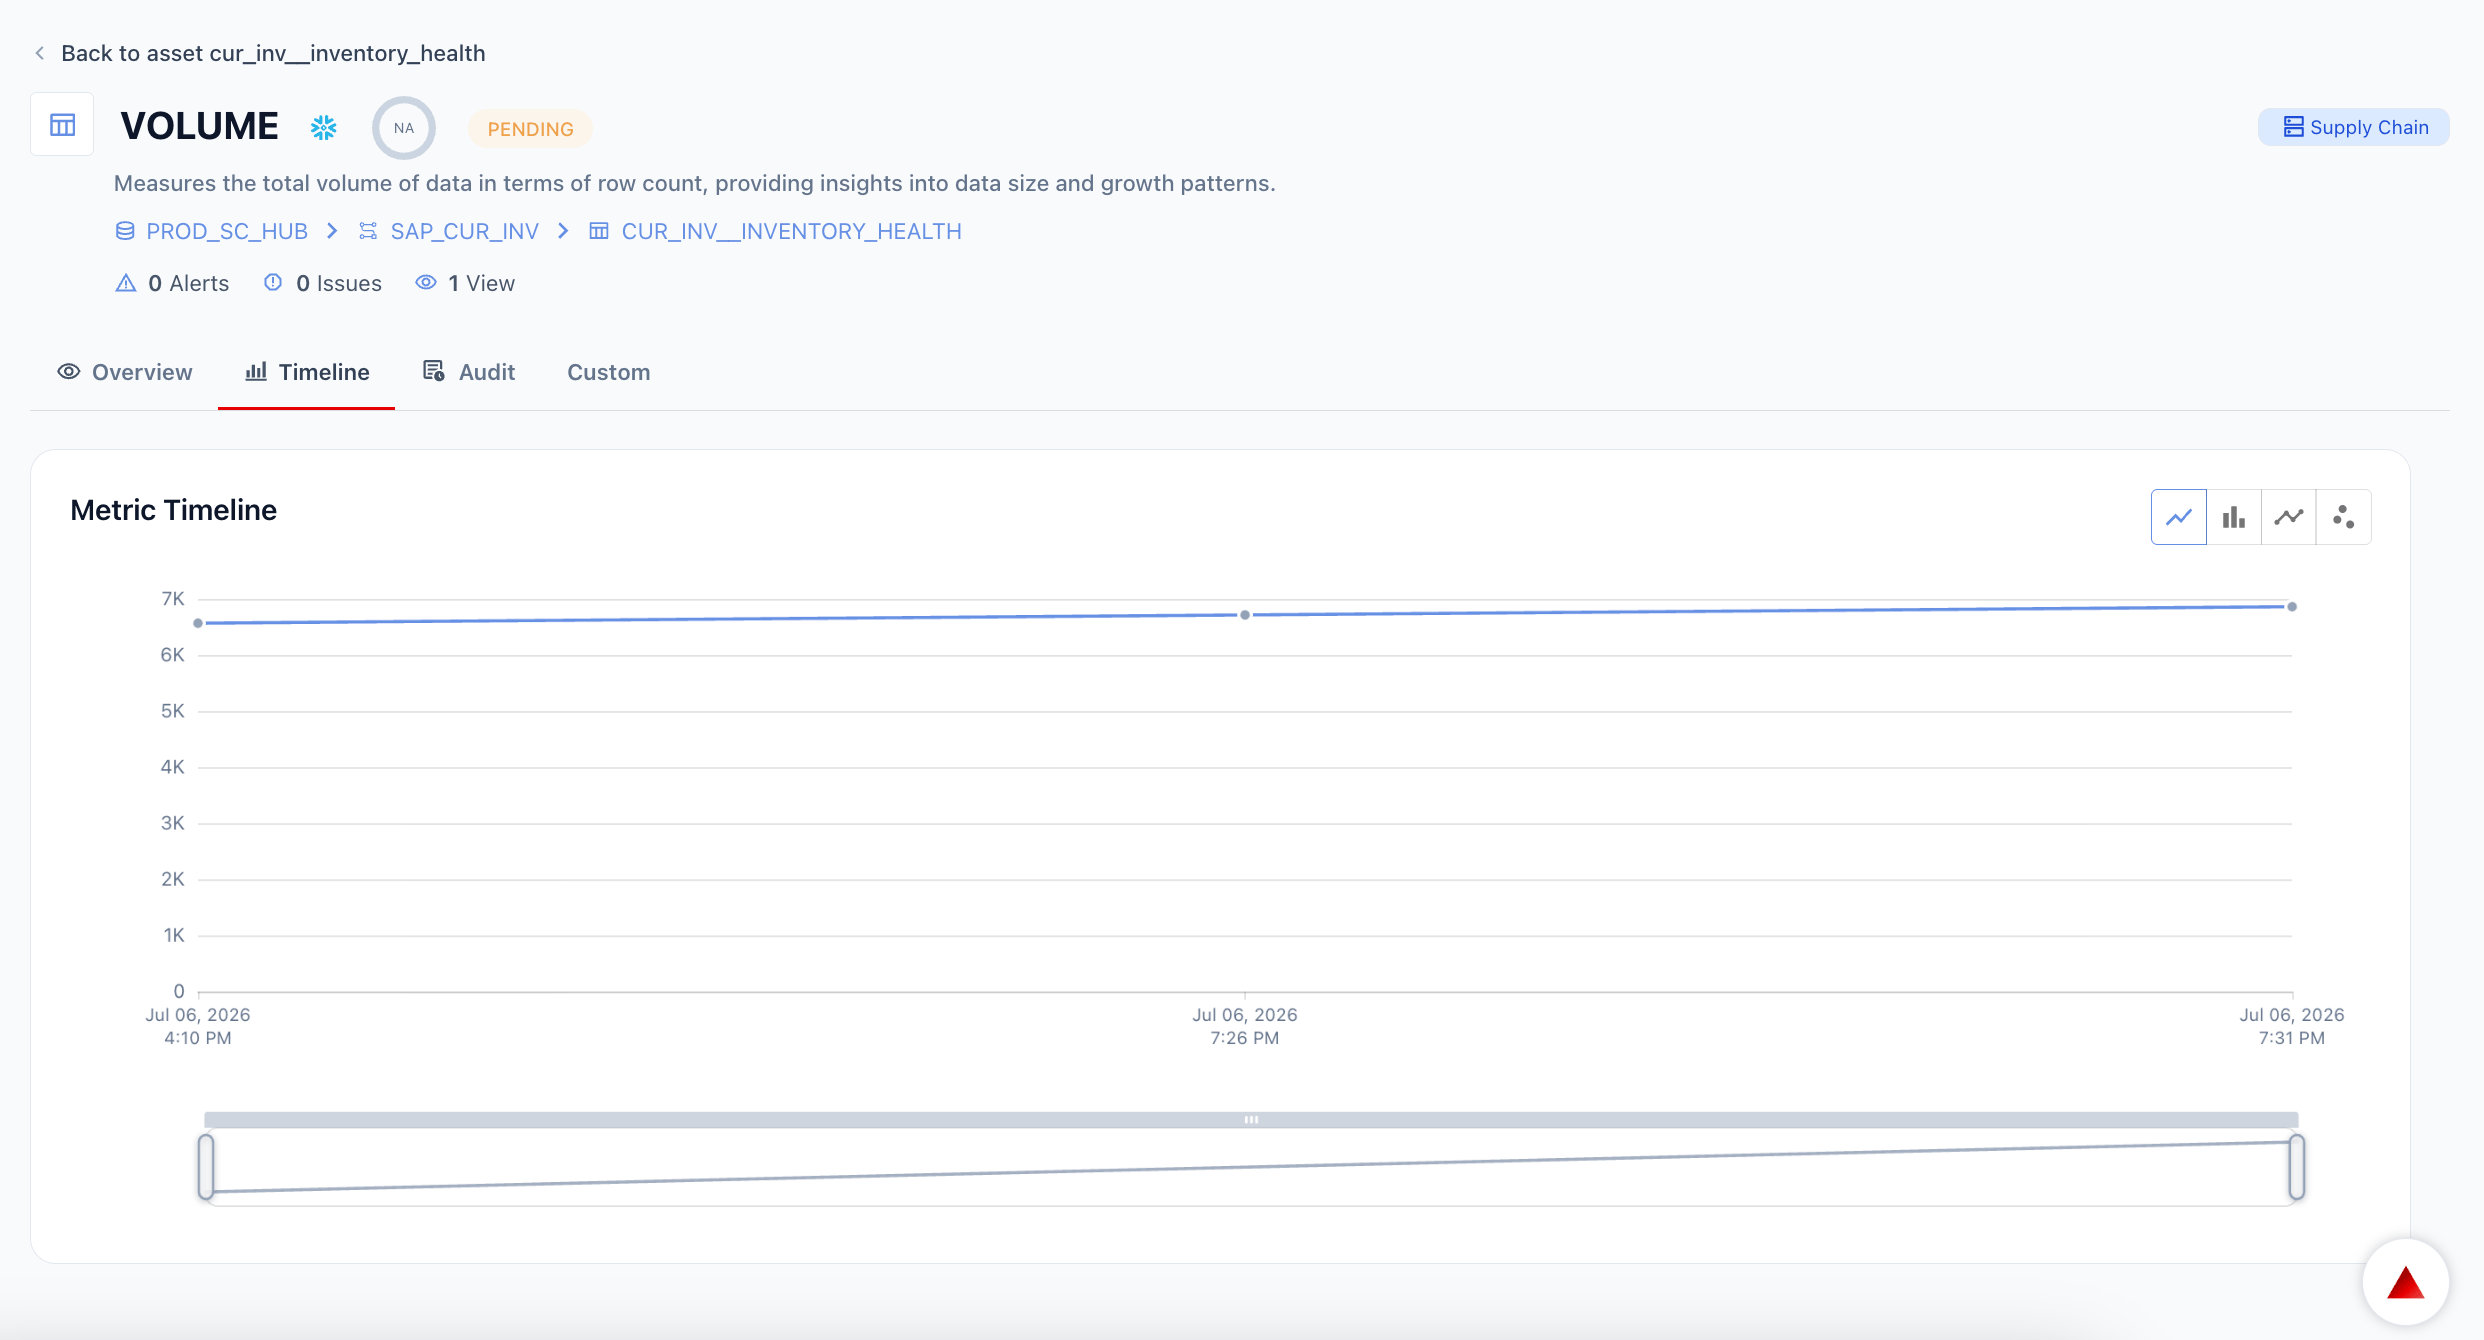
> How to configure Prizm's Volume metric, including automated and custom thresholds for row count and data size alerts.
## Configuring a Volume metric
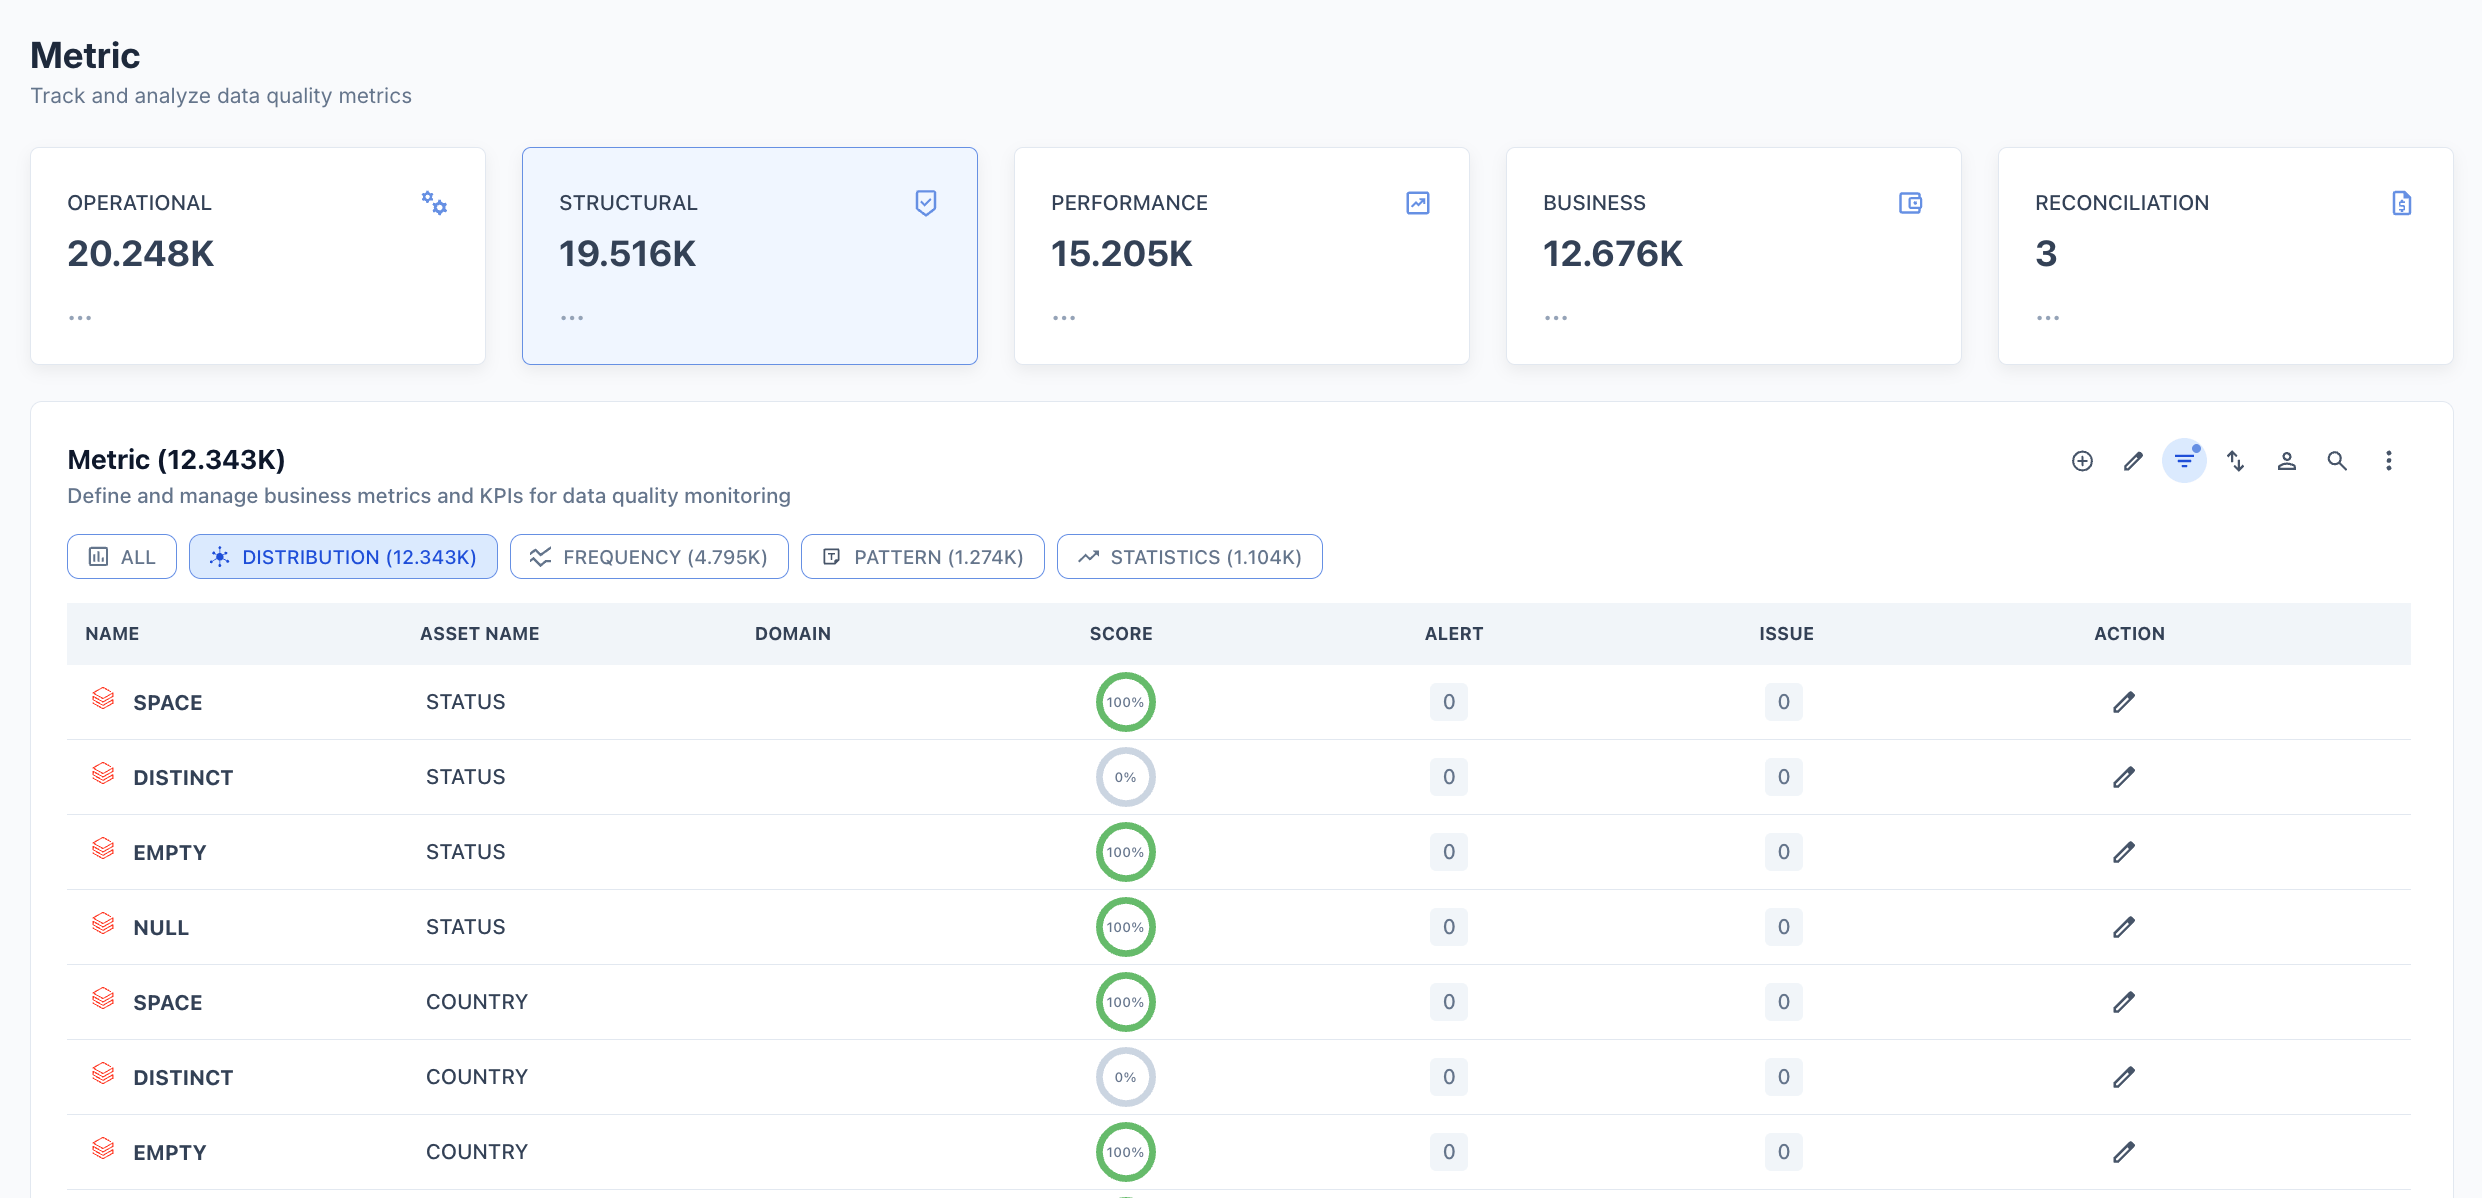
Volume metrics are automatically active on every connected asset. Configuration is optional — the defaults cover most use cases. To view or configure a Volume metric:
1. Navigate to **Asset** and open the asset page.
2. Click the **Metric** tab.
3. Select the **AVAILABILITY** filter chip.
4. Click **VOLUME** in the list to open its detail page.
5. Click the **Edit configuration** icon (pencil) to open the configuration panel.
 ## Configuration options
| Option | Description |
| ----------------- | ----------------------------------------------------------------- |
| **Valid** | Whether a result within the pass criteria counts as a valid run |
| **Scoring** | Include this metric in the asset's overall quality score |
| **Weightage%** | Relative weight of this metric in the overall score (default 100) |
| **Pass Criteria** | The condition the result must satisfy to pass (default `>= 100`) |
| **Export** | Include metric results in data exports |
## Threshold
Choose how Prizm determines when to raise a Volume alert.
**Automated Threshold** — System-generated thresholds based on historical data patterns. Prizm computes the statistical baseline from past run values and maps deviation magnitude to alert priority:
| Priority | Deviation | Default | Description |
| ------------ | --------- | ------- | ---------------------------------------------------------------------------- |
| **Low** | 0σ – 1σ | Off | Within expected statistical variation. No action required. |
| **Medium** | 1σ – 2σ | Off | Moderate deviation detected. Monitor for potential drift or emerging issues. |
| **High** | 2σ – 3σ | **On** | Significant anomaly detected. Investigation recommended. |
| **Critical** | ≥ 3σ | **On** | Extreme deviation detected. Immediate action required. |
The threshold description shows the actual row-count range Prizm is currently using — for example, "currently between 7.5M – 7.5M rows" — based on observed historical values.
**Custom Threshold** — User-defined upper and/or lower limits for triggering alerts. Use when you need a hard floor on row count (e.g., alert if row count drops below 10,000) regardless of historical baseline.
## Configuration options
| Option | Description |
| ----------------- | ----------------------------------------------------------------- |
| **Valid** | Whether a result within the pass criteria counts as a valid run |
| **Scoring** | Include this metric in the asset's overall quality score |
| **Weightage%** | Relative weight of this metric in the overall score (default 100) |
| **Pass Criteria** | The condition the result must satisfy to pass (default `>= 100`) |
| **Export** | Include metric results in data exports |
## Threshold
Choose how Prizm determines when to raise a Volume alert.
**Automated Threshold** — System-generated thresholds based on historical data patterns. Prizm computes the statistical baseline from past run values and maps deviation magnitude to alert priority:
| Priority | Deviation | Default | Description |
| ------------ | --------- | ------- | ---------------------------------------------------------------------------- |
| **Low** | 0σ – 1σ | Off | Within expected statistical variation. No action required. |
| **Medium** | 1σ – 2σ | Off | Moderate deviation detected. Monitor for potential drift or emerging issues. |
| **High** | 2σ – 3σ | **On** | Significant anomaly detected. Investigation recommended. |
| **Critical** | ≥ 3σ | **On** | Extreme deviation detected. Immediate action required. |
The threshold description shows the actual row-count range Prizm is currently using — for example, "currently between 7.5M – 7.5M rows" — based on observed historical values.
**Custom Threshold** — User-defined upper and/or lower limits for triggering alerts. Use when you need a hard floor on row count (e.g., alert if row count drops below 10,000) regardless of historical baseline.
 ## Semantic context
Volume metrics are automatically tagged with:
* **Dimension:** Completeness
* **Domain:** Inherited from the asset's domain assignment
To update the semantic context (Domain, Application, Product, Tag) or assign Owners, open the metric in Edit configuration mode and scroll to the **Semantic context** and **Owners** sections.
## Semantic context
Volume metrics are automatically tagged with:
* **Dimension:** Completeness
* **Domain:** Inherited from the asset's domain assignment
To update the semantic context (Domain, Application, Product, Tag) or assign Owners, open the metric in Edit configuration mode and scroll to the **Semantic context** and **Owners** sections.