> ## Documentation Index
> Fetch the complete documentation index at: https://docs.dqlabs.ai/llms.txt
> Use this file to discover all available pages before exploring further.
# Architecture Overview
> PRIZM's core components - context, observability and quality, and how they connect.
## Overview
Prizm features a **cloud-native, containerized architecture** that enables:
* Seamless integration with existing data ecosystems
* Horizontal scalability to handle enterprise-level data volumes
* Deployment flexibility — cloud, on-premises, or hybrid
* Open APIs for custom extensions and integrations
## High-Level Architecture
Below is the full Prizm stack in one view: connectors feed the profiling/matching/rule engines, results land in the per-tenant metadata and governance store, the LangGraph agent layer reasons over that metadata via LLM, and everything surfaces through dashboards, alerts, and integrations — with observability/cost and deployment as cross-cutting concerns underneath it all.
 **Sources & Connectors.** SQL warehouses (E.g., Snowflake, BigQuery, Databricks, Postgres) connect natively and support pushdown execution — sampling, window functions, aggregates all run inside the warehouse. API-based sources (E.g., Salesforce and similar SaaS apps) connect through batched calls constrained by each vendor's rate limits and quota tiers. File sources (E.g., CSV, Parquet) go through a staged load rather than direct query.
**Processing Engines.** Three engines sit on top of the connectors. The profiling engine picks a scope (full, incremental, filtered, or sampling) and a type (essential or advanced) per asset, trading completeness for speed — sampling tiers run from 100% under 10GB down to about 5% above 1TB. The matching/lookup engine runs candidate blocking (hash join or Bloom filter, cutting candidate volume 70–90%) followed by scoring with configurable tolerance. The rule engine splits into two paths: single-field rules push down as native SQL and run entirely inside one warehouse; cross-dataset rules can't do that because sources like Oracle, Snowflake, Athena, and MySQL can't be joined directly, so they route through a newer Iceberg-based staging layer that extracts and unifies data before comparison. All three engines share the same concurrency controls — semaphore caps on parallel calls and batched key aggregation.
**Metadata & Governance Store.** A per-tenant Postgres instance (CloudNativePG, high availability) holds the system of record: polymorphic Asset objects with connector-specific extensions, Attribute and Lineage graphs, Tags/Policies/Glossary terms for governance, MetricDetail and Exception records from rule runs, and PgVector embeddings for semantic search. Depending on deployment, one of three metastore approaches applies (Iceberg-backed, Postgres-native, or writeback), and read replicas feed the Superset analytics layer without touching production write paths.
**Agentic AI Layer.** A LangGraph state graph, coordinated by a Master Agent (supervisor → router → sub-agent or output parser), drives the AI behavior. Specialist sub-agents handle anomaly and seasonality detection, lineage and impact analysis, root-cause investigation, remediation recommendations (advisory only — no autonomous write-back to source systems exists today), rule proposal/authoring, and a steward copilot for human-in-the-loop approval. Individual agents are built in one of three styles: pure LLM reasoning, a hybrid of LLM plus deterministic tools, or a pure deterministic workflow with an optional LLM kill-switch. Azure OpenAI and Anthropic (Claude) are both live, supported LLM backends today — multi-provider support is shipped, not roadmap — with model selection and routing configurable per task under **Organization → Platform → Configuration**. The specific default model assigned to each task type varies by release and is not repeated here; see that in-product configuration screen for the current defaults rather than relying on a hardcoded model name. A documented policy keeps raw warehouse rows out of prompts by default — the AI Gateway only forwards aggregates and metadata.
**Insights & Activation Layer.** This is where output becomes usable: Superset-based dashboards and BI reporting for insight, an alerting and stewardship-actions workflow for human review/override/revert, and three integration buckets — ticketing (Jira is GA, ServiceNow is GA), catalog (Alation, Collibra), and communication (Slack, Teams, email). Extensibility here is a file-discovery convention (subclass a base tool, register it), not a plugin marketplace.
**Cross-cutting: Observability & Cost, and Deployment.** Langfuse (self-hosted) traces the Master Agent today — sub-agent tracing isn't wired up yet — capturing tokens, tool calls, latency, and session IDs, feeding a DevOps Portal with tenant health, infrastructure monitoring, and a cost/FinOps dashboard with per-asset credit attribution. Deployment supports three topologies (on-prem/customer-hosted, cloud SaaS, and hybrid via a customer-hosted agent bridging cloud and on-prem sources), released through Terraform-provisioned EKS/AKS clusters and ArgoCD GitOps with tag-based promotion from build through qa, release, and prod.
## Control Plane
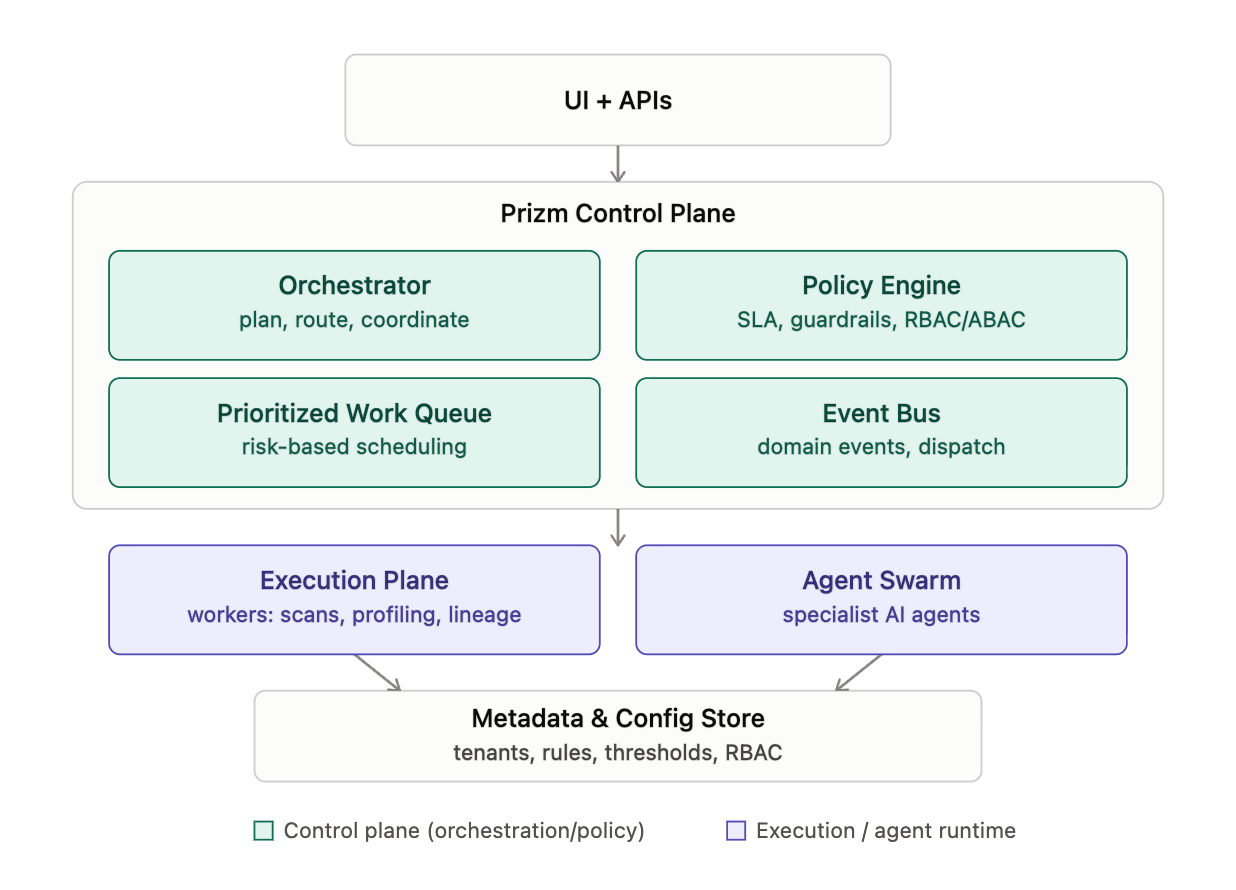
The Prizm control plane is the layer that sits between the UI/API and everything that actually touches customer data. It doesn't run scans or hold credentials itself — it decides what runs, when, and under what rules, then dispatches that work down.
Four parts do the work: an orchestrator that plans, routes, and coordinates requests (also described in the docs as planner/router/memory for the agent layer); a policy engine enforcing SLAs, guardrails, and RBAC/ABAC access rules; a prioritized, risk-based work queue that schedules based on data criticality rather than FIFO order; and an event bus that carries domain events and dispatches tasks. This matches how the platform's own architecture docs define it — "orchestrate configuration, scheduling, policies, metadata management, and access control" — as a distinct layer from the execution plane.
Below the control plane sit the execution plane (workers running scans, profiling, and lineage capture) and the agent swarm (the specialist AI agents — discovery, profiling, DQ rules, observability, anomaly detection, root cause, remediation, steward copilot). Both write results back into a shared metadata and configuration store holding tenant settings, rules, thresholds, and RBAC assignments — never raw source data.
**Sources & Connectors.** SQL warehouses (E.g., Snowflake, BigQuery, Databricks, Postgres) connect natively and support pushdown execution — sampling, window functions, aggregates all run inside the warehouse. API-based sources (E.g., Salesforce and similar SaaS apps) connect through batched calls constrained by each vendor's rate limits and quota tiers. File sources (E.g., CSV, Parquet) go through a staged load rather than direct query.
**Processing Engines.** Three engines sit on top of the connectors. The profiling engine picks a scope (full, incremental, filtered, or sampling) and a type (essential or advanced) per asset, trading completeness for speed — sampling tiers run from 100% under 10GB down to about 5% above 1TB. The matching/lookup engine runs candidate blocking (hash join or Bloom filter, cutting candidate volume 70–90%) followed by scoring with configurable tolerance. The rule engine splits into two paths: single-field rules push down as native SQL and run entirely inside one warehouse; cross-dataset rules can't do that because sources like Oracle, Snowflake, Athena, and MySQL can't be joined directly, so they route through a newer Iceberg-based staging layer that extracts and unifies data before comparison. All three engines share the same concurrency controls — semaphore caps on parallel calls and batched key aggregation.
**Metadata & Governance Store.** A per-tenant Postgres instance (CloudNativePG, high availability) holds the system of record: polymorphic Asset objects with connector-specific extensions, Attribute and Lineage graphs, Tags/Policies/Glossary terms for governance, MetricDetail and Exception records from rule runs, and PgVector embeddings for semantic search. Depending on deployment, one of three metastore approaches applies (Iceberg-backed, Postgres-native, or writeback), and read replicas feed the Superset analytics layer without touching production write paths.
**Agentic AI Layer.** A LangGraph state graph, coordinated by a Master Agent (supervisor → router → sub-agent or output parser), drives the AI behavior. Specialist sub-agents handle anomaly and seasonality detection, lineage and impact analysis, root-cause investigation, remediation recommendations (advisory only — no autonomous write-back to source systems exists today), rule proposal/authoring, and a steward copilot for human-in-the-loop approval. Individual agents are built in one of three styles: pure LLM reasoning, a hybrid of LLM plus deterministic tools, or a pure deterministic workflow with an optional LLM kill-switch. Azure OpenAI and Anthropic (Claude) are both live, supported LLM backends today — multi-provider support is shipped, not roadmap — with model selection and routing configurable per task under **Organization → Platform → Configuration**. The specific default model assigned to each task type varies by release and is not repeated here; see that in-product configuration screen for the current defaults rather than relying on a hardcoded model name. A documented policy keeps raw warehouse rows out of prompts by default — the AI Gateway only forwards aggregates and metadata.
**Insights & Activation Layer.** This is where output becomes usable: Superset-based dashboards and BI reporting for insight, an alerting and stewardship-actions workflow for human review/override/revert, and three integration buckets — ticketing (Jira is GA, ServiceNow is GA), catalog (Alation, Collibra), and communication (Slack, Teams, email). Extensibility here is a file-discovery convention (subclass a base tool, register it), not a plugin marketplace.
**Cross-cutting: Observability & Cost, and Deployment.** Langfuse (self-hosted) traces the Master Agent today — sub-agent tracing isn't wired up yet — capturing tokens, tool calls, latency, and session IDs, feeding a DevOps Portal with tenant health, infrastructure monitoring, and a cost/FinOps dashboard with per-asset credit attribution. Deployment supports three topologies (on-prem/customer-hosted, cloud SaaS, and hybrid via a customer-hosted agent bridging cloud and on-prem sources), released through Terraform-provisioned EKS/AKS clusters and ArgoCD GitOps with tag-based promotion from build through qa, release, and prod.
## Control Plane
The Prizm control plane is the layer that sits between the UI/API and everything that actually touches customer data. It doesn't run scans or hold credentials itself — it decides what runs, when, and under what rules, then dispatches that work down.
Four parts do the work: an orchestrator that plans, routes, and coordinates requests (also described in the docs as planner/router/memory for the agent layer); a policy engine enforcing SLAs, guardrails, and RBAC/ABAC access rules; a prioritized, risk-based work queue that schedules based on data criticality rather than FIFO order; and an event bus that carries domain events and dispatches tasks. This matches how the platform's own architecture docs define it — "orchestrate configuration, scheduling, policies, metadata management, and access control" — as a distinct layer from the execution plane.
Below the control plane sit the execution plane (workers running scans, profiling, and lineage capture) and the agent swarm (the specialist AI agents — discovery, profiling, DQ rules, observability, anomaly detection, root cause, remediation, steward copilot). Both write results back into a shared metadata and configuration store holding tenant settings, rules, thresholds, and RBAC assignments — never raw source data.
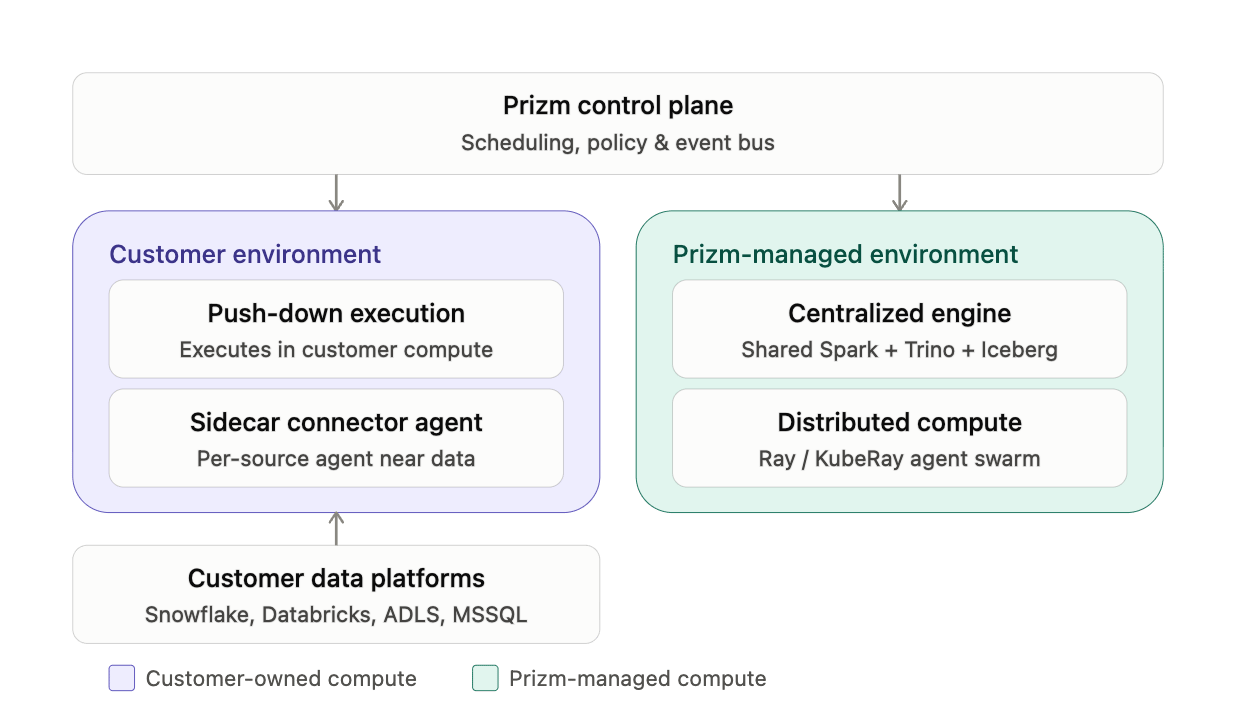
 Placement shifts by deployment model: in SaaS it's fully DQLabs-hosted; in customer-managed deployments it runs inside the customer's environment; in hybrid, the control plane and UI can stay centralized while execution runs closer to the customer's data.
One distinction worth flagging: there's also a separate "Prizm Control Hub" — an internal DQLabs ops platform (`prizm-admin` / `prizm-admin-ui`) for license management, tenant provisioning, and DevOps monitoring across the whole fleet of tenants. That's a fleet-management control plane for DQLabs' own teams, not the per-tenant runtime control plane described above.
### Knowledge & State Store
Prizm maintains a rich, interconnected knowledge base:
| Store | Contents |
| ------------------- | ------------------------------------------------------------------------- |
| **Unified Catalog** | All assets — tables, models, pipelines, dashboards — with owners and tags |
| **Semantic Layer** | Business terms, KPIs, glossaries, and domain context |
| **Knowledge Graph** | Relationships, lineage, and dependency maps |
| **Vector Store** | Runbooks, incident histories, and documentation for RAG-based AI |
| **Operational Log** | Single unified observability table across all agents |
## Sub-System Documentation
Core entity relationships and schema design.
Child (One level down) in the asset hierarchy
Metric types, execution engine, and scoring.
CRON, event-based, and intelligent schedule management.
Quality score schema, attributes, and relationships.
Deployment topology and infrastructure requirements.
Placement shifts by deployment model: in SaaS it's fully DQLabs-hosted; in customer-managed deployments it runs inside the customer's environment; in hybrid, the control plane and UI can stay centralized while execution runs closer to the customer's data.
One distinction worth flagging: there's also a separate "Prizm Control Hub" — an internal DQLabs ops platform (`prizm-admin` / `prizm-admin-ui`) for license management, tenant provisioning, and DevOps monitoring across the whole fleet of tenants. That's a fleet-management control plane for DQLabs' own teams, not the per-tenant runtime control plane described above.
### Knowledge & State Store
Prizm maintains a rich, interconnected knowledge base:
| Store | Contents |
| ------------------- | ------------------------------------------------------------------------- |
| **Unified Catalog** | All assets — tables, models, pipelines, dashboards — with owners and tags |
| **Semantic Layer** | Business terms, KPIs, glossaries, and domain context |
| **Knowledge Graph** | Relationships, lineage, and dependency maps |
| **Vector Store** | Runbooks, incident histories, and documentation for RAG-based AI |
| **Operational Log** | Single unified observability table across all agents |
## Sub-System Documentation
Core entity relationships and schema design.
Child (One level down) in the asset hierarchy
Metric types, execution engine, and scoring.
CRON, event-based, and intelligent schedule management.
Quality score schema, attributes, and relationships.
Deployment topology and infrastructure requirements.