> ## Documentation Index
> Fetch the complete documentation index at: https://docs.dqlabs.ai/llms.txt
> Use this file to discover all available pages before exploring further.
# Assets: Discover and manage your context in PRIZM
> Assets are the tables, views, attributes, queries, pipelines, reports, and semantic models PRIZM tracks across your connected databases and data platforms.
Assets are the central objects in PRIZM. Every table, view, attribute, query, pipeline, report, and semantic model connected to your data sources appears as an asset, giving you a single place to search, inspect, and monitor your entire data catalog. When you open the Assets page you can search across all databases and platforms, filter by asset type, and drill into any individual asset to see its schema, metrics, lineage, and documentation.
## Asset types
PRIZM organizes assets by its native type. Use the tab bar on the Assets page to filter the list to the type you need.
 [Click here for detailed asset types available in Prizm](/architecture/asset-type)
## Asset Page — View Modes & Search
The Asset page offers three view layouts (toggled via the icons top-right of the page) plus a global search bar for data discovery — each suited to a different way of exploring your catalog.
***
### 1. Search View (Default)
The default landing view, organized around **"Top Asset"** with a type filter bar (All, Attribute, Table, View, Model, Test, Warehouse, Source, etc.) showing live counts per type.
[Click here for detailed asset types available in Prizm](/architecture/asset-type)
## Asset Page — View Modes & Search
The Asset page offers three view layouts (toggled via the icons top-right of the page) plus a global search bar for data discovery — each suited to a different way of exploring your catalog.
***
### 1. Search View (Default)
The default landing view, organized around **"Top Asset"** with a type filter bar (All, Attribute, Table, View, Model, Test, Warehouse, Source, etc.) showing live counts per type.
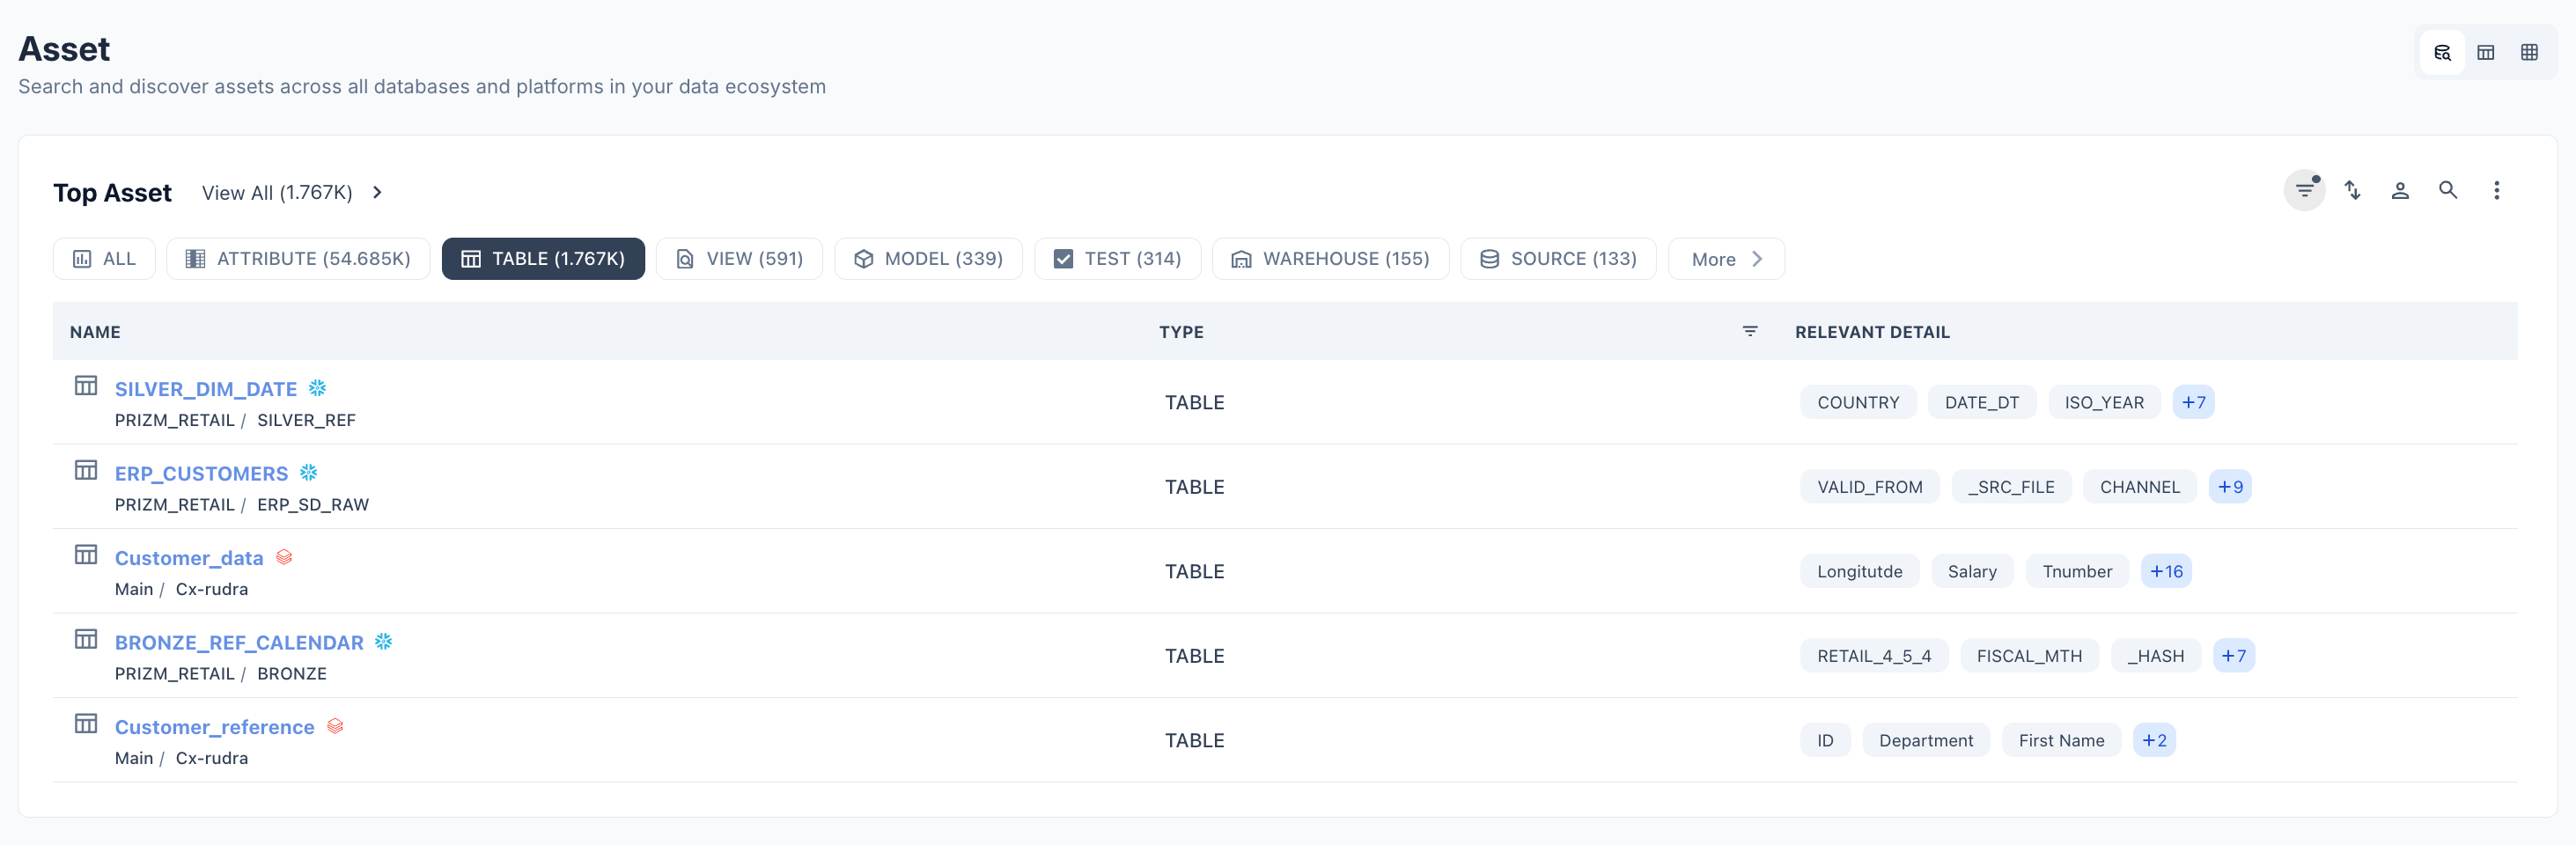 * Displays assets in a **compact list** with **Name**, **Type**, and **Relevant Detail** (key attributes/columns associated with the asset).
* Includes a **Documentation** panel below, surfacing recently created or relevant docs (READMEs, category docs, etc.) tied to assets.
* Best for: **quick scanning** across asset types and jumping straight into documentation context.
***
### 2. Table View
A **dashboard-style summary** at the top (Attribute, Table, View, Model, Test, Warehouse counts with trend % changes), followed by a **structured data grid**.
* Displays assets in a **compact list** with **Name**, **Type**, and **Relevant Detail** (key attributes/columns associated with the asset).
* Includes a **Documentation** panel below, surfacing recently created or relevant docs (READMEs, category docs, etc.) tied to assets.
* Best for: **quick scanning** across asset types and jumping straight into documentation context.
***
### 2. Table View
A **dashboard-style summary** at the top (Attribute, Table, View, Model, Test, Warehouse counts with trend % changes), followed by a **structured data grid**.
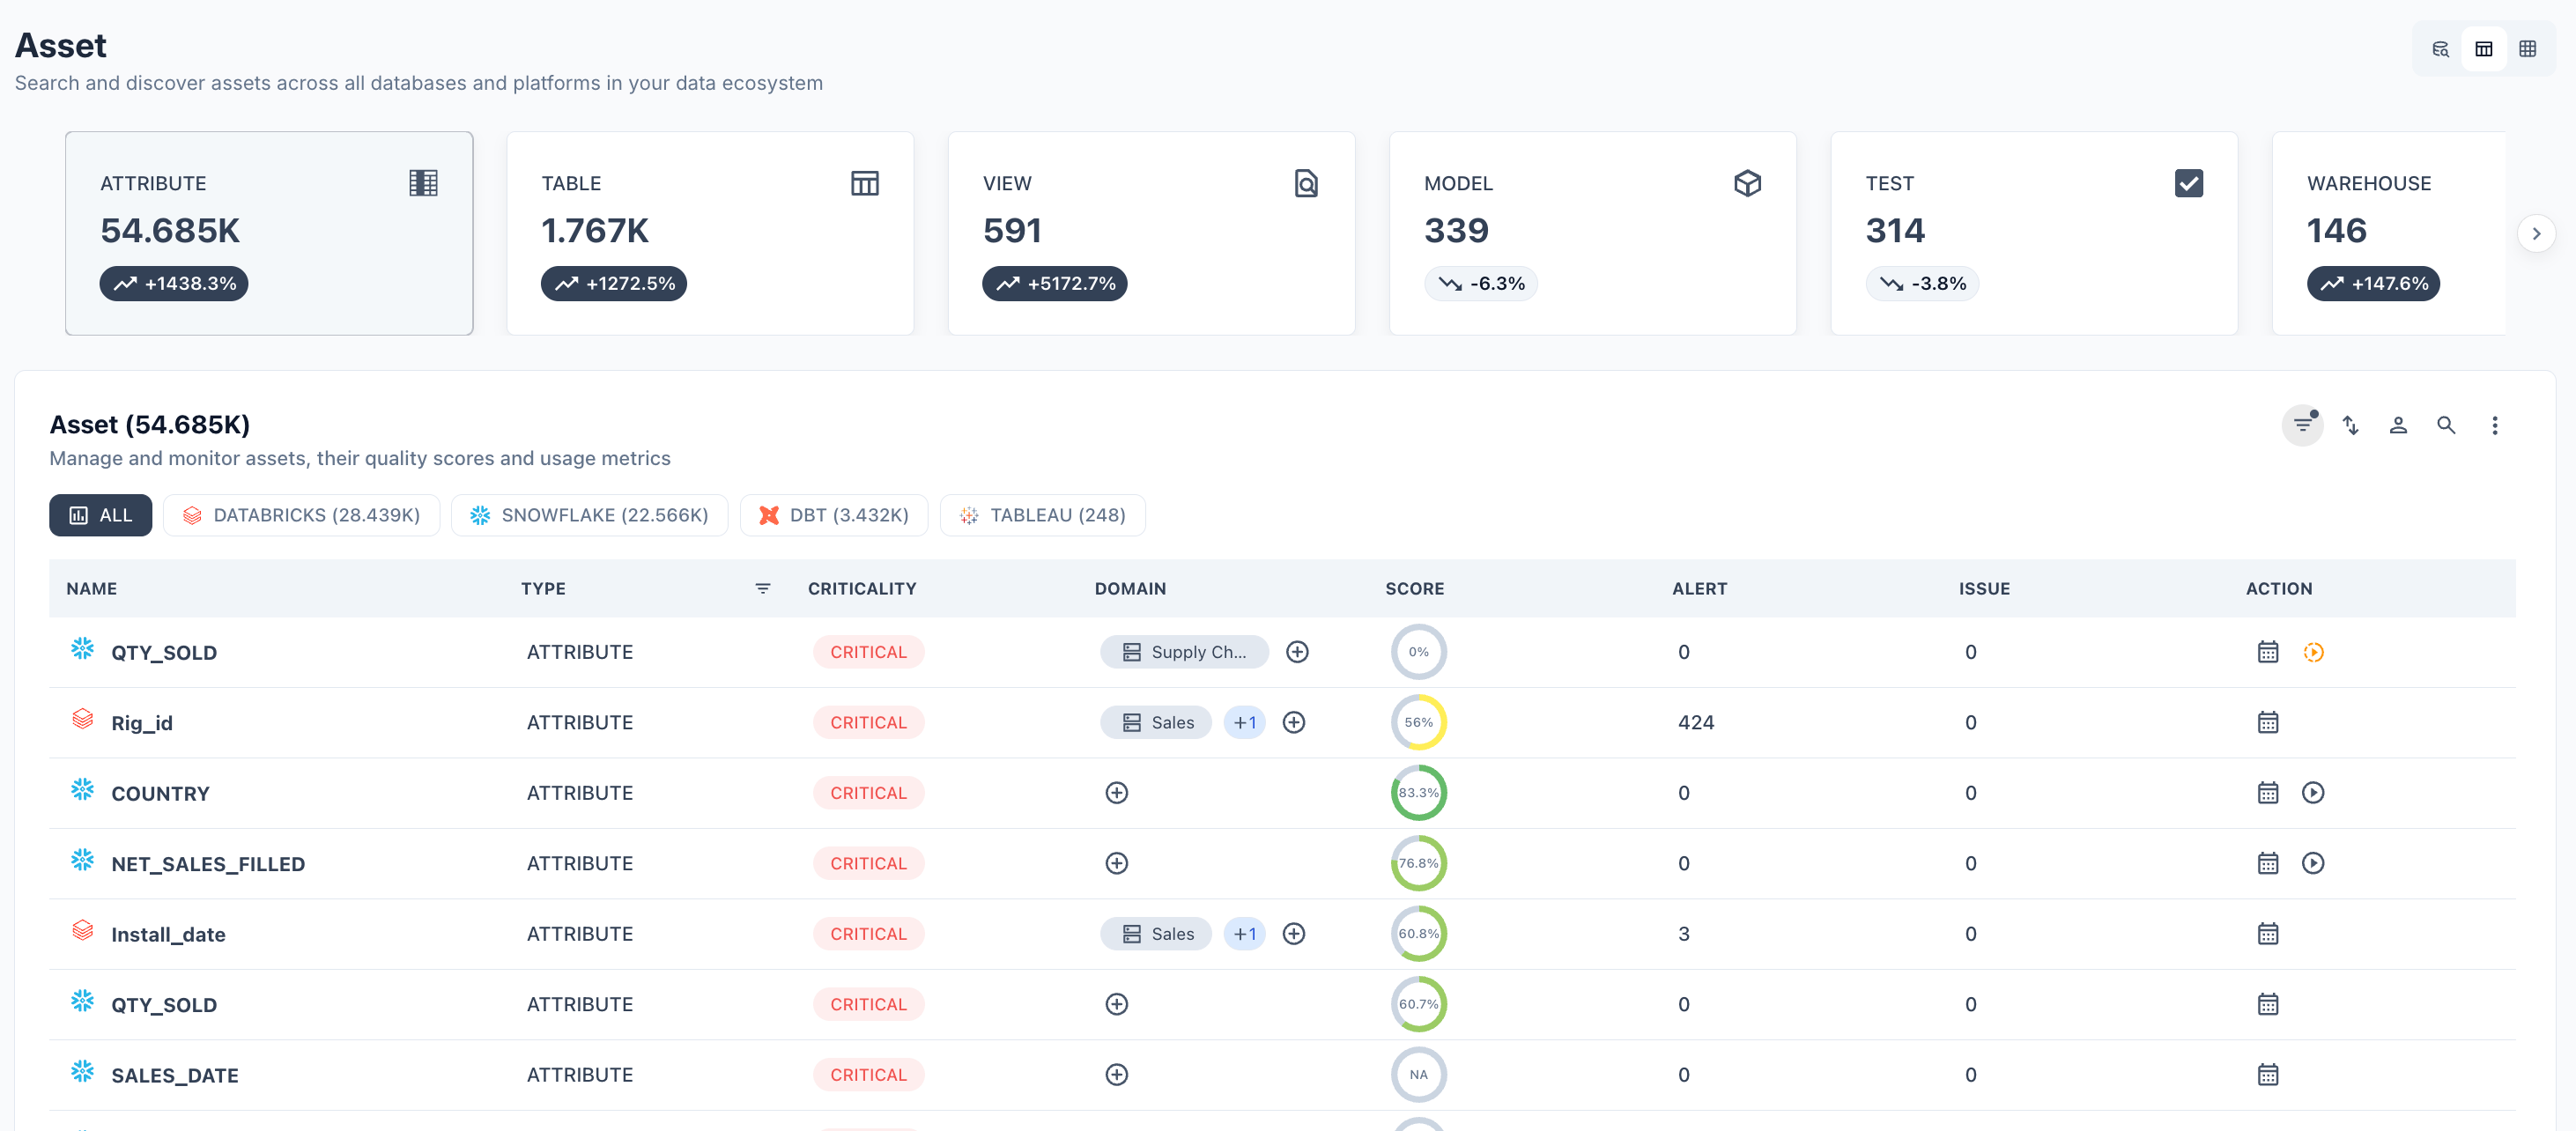 * Filterable by **source platform** (Snowflake, Databricks, dbt, etc.).
* Grid columns include **Name, Type, Criticality, Domain, Score, Alert, Issue, Action** — giving a governance-and-quality-first view of every asset.
* Supports **saved views** ("+ Filter", "Save as view") for repeatable, filtered asset lists.
* Best for: **operational monitoring** — triaging assets by criticality, score, alerts, and issues in one sortable table.
***
### 3. Grid View
Displays assets as **individual cards**, each showing name, source icon, path/breadcrumb, attribute count, a short AI-generated description, tags, score (with a circular gauge), and Alert/Issue counts.
* Filterable by **source platform** (Snowflake, Databricks, dbt, etc.).
* Grid columns include **Name, Type, Criticality, Domain, Score, Alert, Issue, Action** — giving a governance-and-quality-first view of every asset.
* Supports **saved views** ("+ Filter", "Save as view") for repeatable, filtered asset lists.
* Best for: **operational monitoring** — triaging assets by criticality, score, alerts, and issues in one sortable table.
***
### 3. Grid View
Displays assets as **individual cards**, each showing name, source icon, path/breadcrumb, attribute count, a short AI-generated description, tags, score (with a circular gauge), and Alert/Issue counts.
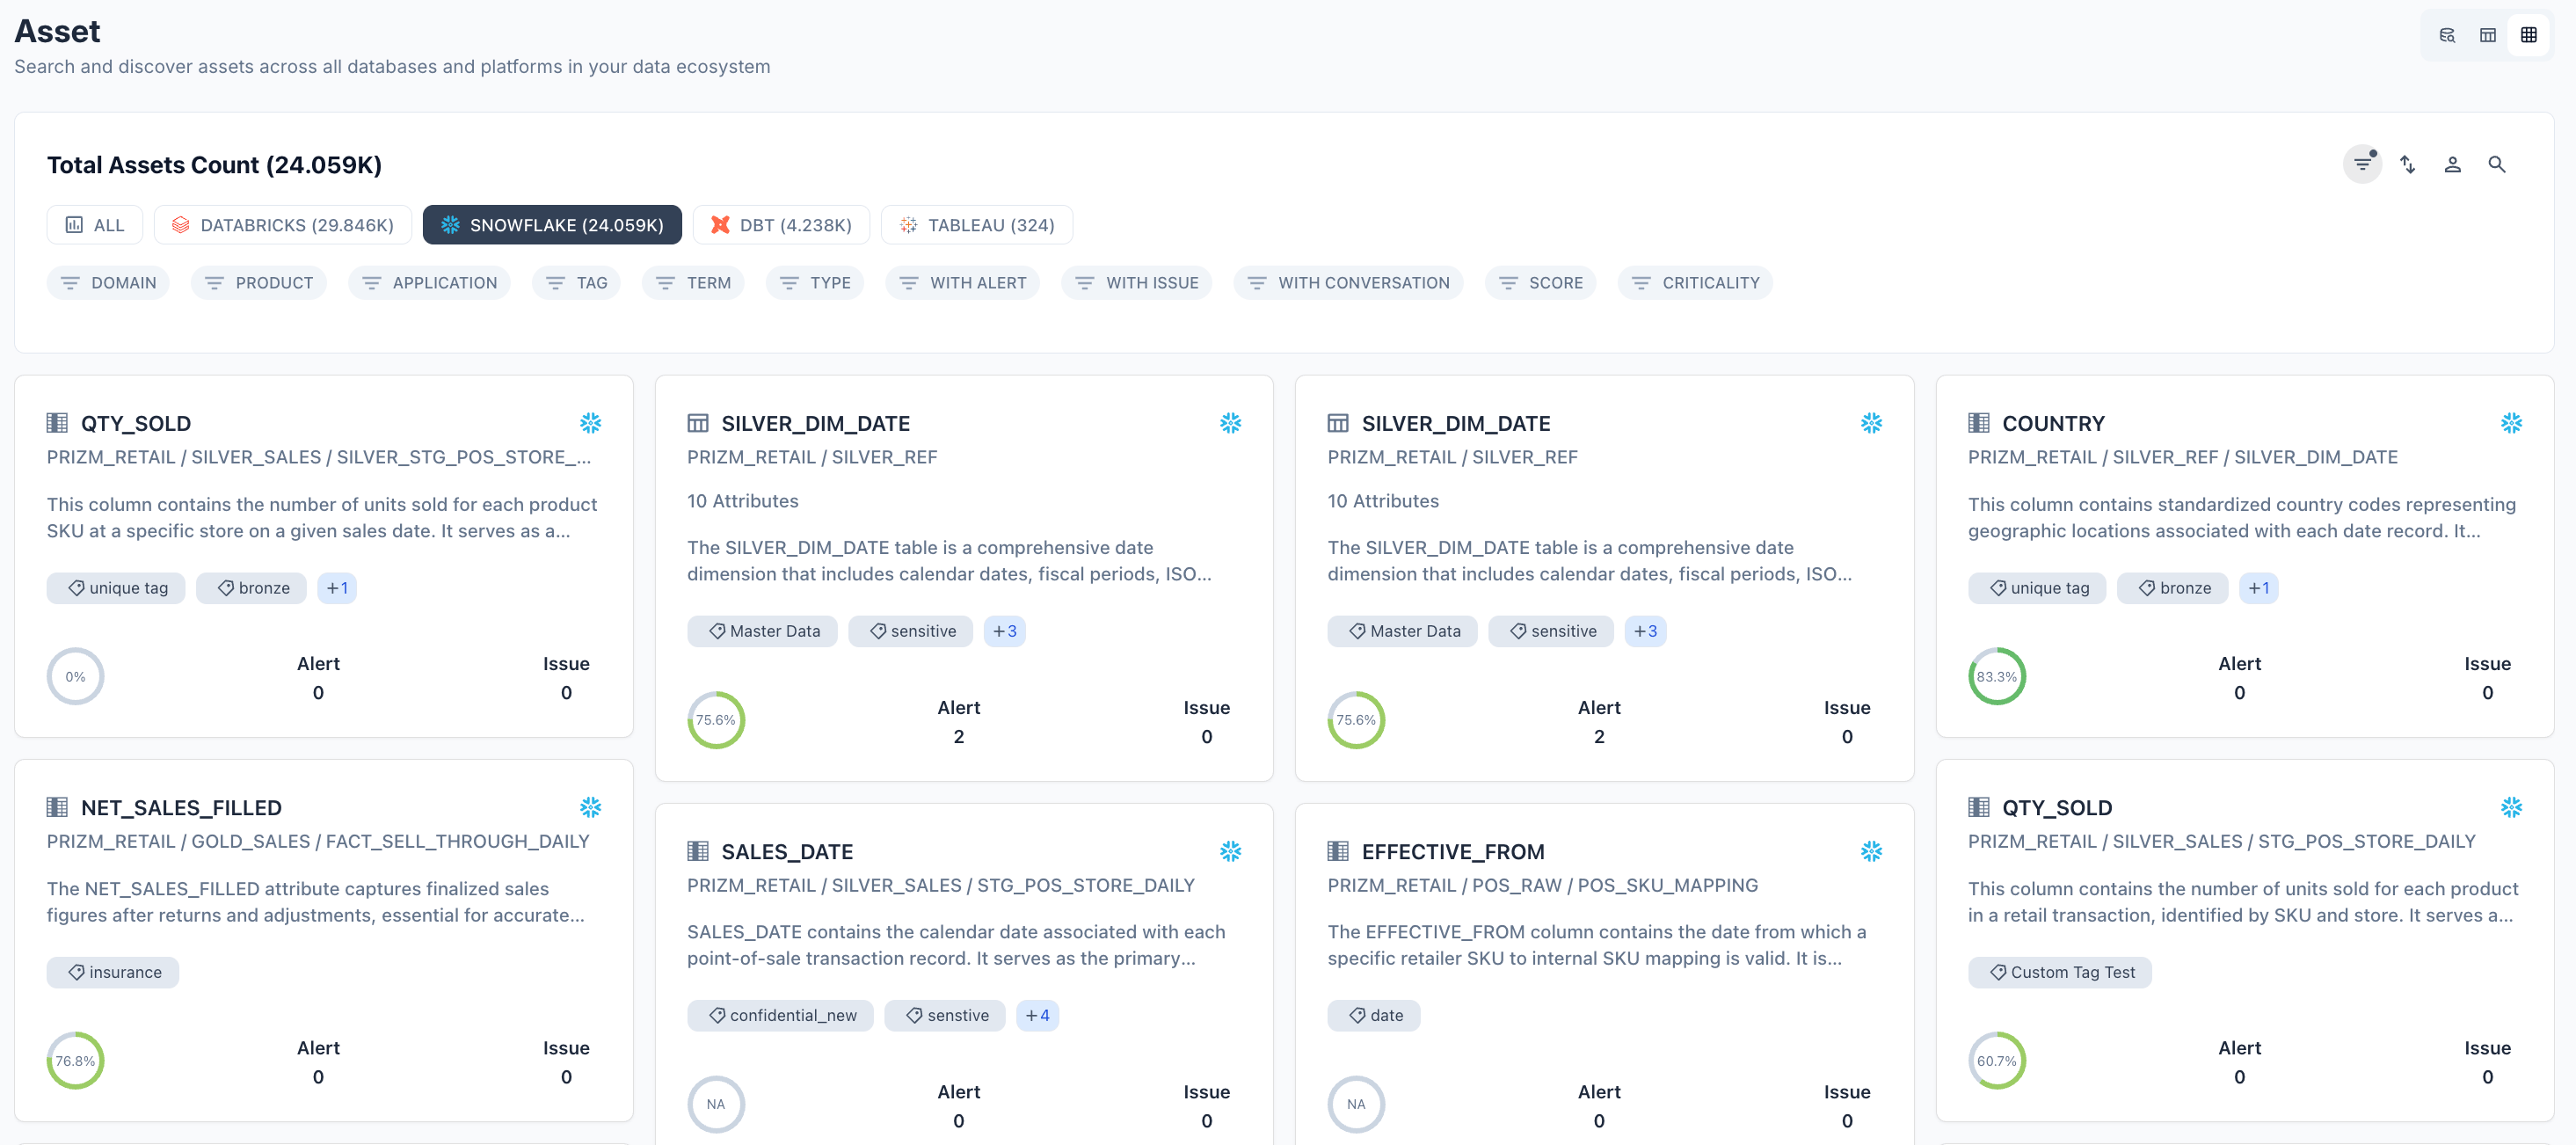 * Filterable by **platform** (Databricks, Snowflake, dbt, Tableau) and a rich set of facets: **Domain, Product, Application, Tag, Term, Type, With Alert, With Issue, With Conversation, Score, Criticality.**
* Best for: **visual browsing** — getting context and quality signals on multiple assets at a glance, especially useful when exploring unfamiliar parts of the catalog.
***
### Global Search (⌘K)
The search bar at the top of every Asset page (shortcut **⌘K**) is the fastest path to any asset, regardless of which view you're in.
* Filterable by **platform** (Databricks, Snowflake, dbt, Tableau) and a rich set of facets: **Domain, Product, Application, Tag, Term, Type, With Alert, With Issue, With Conversation, Score, Criticality.**
* Best for: **visual browsing** — getting context and quality signals on multiple assets at a glance, especially useful when exploring unfamiliar parts of the catalog.
***
### Global Search (⌘K)
The search bar at the top of every Asset page (shortcut **⌘K**) is the fastest path to any asset, regardless of which view you're in.
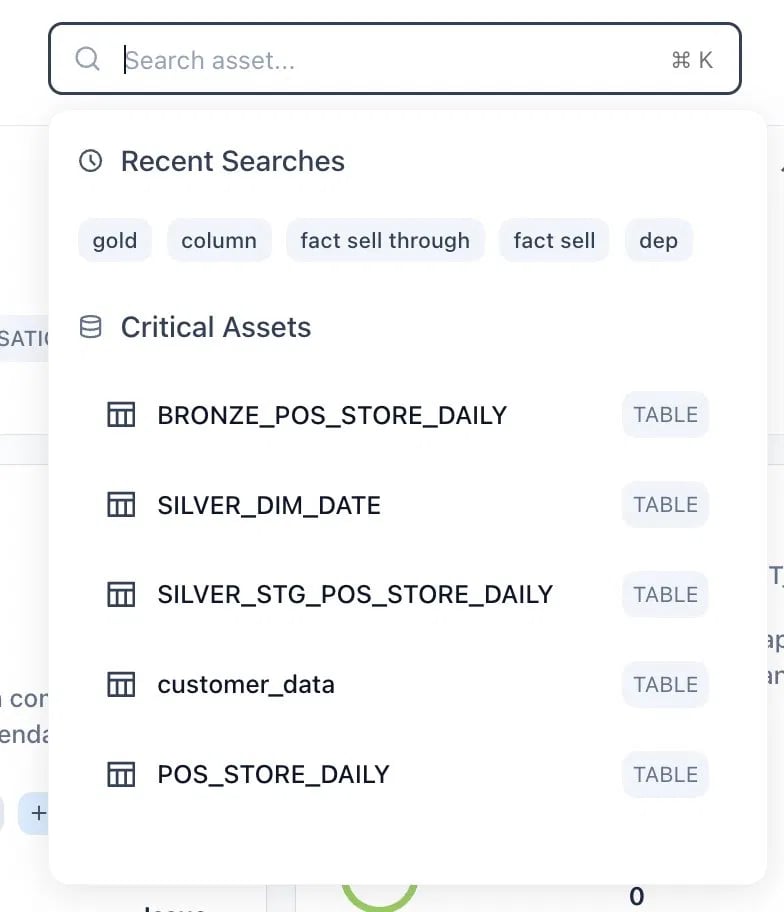 * **Recent Searches** — quick-access chips of your last queries (e.g., "gold," "fact sell through") to resume previous exploration.
* **Critical Assets** — a curated shortcut list surfacing high-criticality tables (e.g., `BRONZE_POS_STORE_DAILY`, `SILVER_DIM_DATE`) so the most business-sensitive assets are always one click away.
* Searches span **all connected databases and platforms** simultaneously — by asset name, source, or column — without needing to switch tabs or filters first.
***
### Choosing the Right View
| View | Best For |
| :--------------------- | :---------------------------------------------------------------- |
| **Search/List View** | Fast scanning by type + jumping into related documentation |
| **Table View** | Governance triage — sorting by criticality, score, alerts, issues |
| **Grid View** | Visual, context-rich browsing with descriptions and tags |
| **Global Search (⌘K)** | Jumping directly to a known or critical asset from anywhere |
Use the search bar at the top of the Assets page — or press **⌘K** — to find any asset by name, source, or column across all connected databases without switching tabs.
Together, these views let users move fluidly between **broad discovery** (grid/search) and **focused governance work** (table view) — with the search bar acting as the universal shortcut across all of it.
## Asset Details
Click any asset in the list to open its detail view. Whether you're tracing a single column or mapping an entire pipeline, Prizm treats every object in your data stack — tables, models, dashboards, pipelines, and beyond — as a unified **asset**, searchable and inspectable from one place. The asset type taxonomy gives consistent meaning across platforms, while the detail tabs (Overview, Attributes, Metric, Usage, Lineage, Audit, Documentation, Conversation) give you every lens you need: health, structure, quality, usage, dependencies, history, and context. Together, this makes the Assets page the single source of truth for understanding what data you have, how trustworthy it is, and how it all connects.
The detail view provides the following tabs whenever it is applicable along with any other custom tab the user creates.
A summary of key metrics, recent alerts, and asset information at a glance. Start here to assess the current health of an asset.
A summary of an asset's child objects (e.g. Attribute under Table, Schema under Database) with relevant information for assessing structure.
Time-series charts and current values for all data observability and data quality metrics configured on the asset, such as completeness, uniqueness, volume and freshness.
Query activity, performance, and cost metrics for the asset, with a detailed query log showing the upstream sources and downstream consumers so you can trace the blast radius of an issue.
An interactive lineage graph showing the upstream sources and downstream consumers of the asset, so you can trace the blast radius of a data quality issue.
Chronological log of who did what and when on the asset (views, edits, and other actions), useful for tracking activity and governance.
Free-form documentation attached to the asset — descriptions, usage notes, and links — to help your team understand the data.
A discussion space for the asset where users can start topics, ask questions, and engage with likes/dislikes and bookmarks for team collaboration.
The Assets page provides a single, consistent entry point for discovering and managing every object in your data ecosystem — regardless of source platform. The asset type taxonomy ensures consistent classification across systems, while the detail tabs (Overview, Attributes, Metric, Usage, Lineage, Audit, Documentation, Conversation) give users the specific information needed to assess an asset's health, structure, quality, usage patterns, dependencies, change history, and business context. Together, these capabilities make the Assets page the central reference point for understanding what data exists, how reliable it is, and how it connects to the rest of the data ecosystem.
* **Recent Searches** — quick-access chips of your last queries (e.g., "gold," "fact sell through") to resume previous exploration.
* **Critical Assets** — a curated shortcut list surfacing high-criticality tables (e.g., `BRONZE_POS_STORE_DAILY`, `SILVER_DIM_DATE`) so the most business-sensitive assets are always one click away.
* Searches span **all connected databases and platforms** simultaneously — by asset name, source, or column — without needing to switch tabs or filters first.
***
### Choosing the Right View
| View | Best For |
| :--------------------- | :---------------------------------------------------------------- |
| **Search/List View** | Fast scanning by type + jumping into related documentation |
| **Table View** | Governance triage — sorting by criticality, score, alerts, issues |
| **Grid View** | Visual, context-rich browsing with descriptions and tags |
| **Global Search (⌘K)** | Jumping directly to a known or critical asset from anywhere |
Use the search bar at the top of the Assets page — or press **⌘K** — to find any asset by name, source, or column across all connected databases without switching tabs.
Together, these views let users move fluidly between **broad discovery** (grid/search) and **focused governance work** (table view) — with the search bar acting as the universal shortcut across all of it.
## Asset Details
Click any asset in the list to open its detail view. Whether you're tracing a single column or mapping an entire pipeline, Prizm treats every object in your data stack — tables, models, dashboards, pipelines, and beyond — as a unified **asset**, searchable and inspectable from one place. The asset type taxonomy gives consistent meaning across platforms, while the detail tabs (Overview, Attributes, Metric, Usage, Lineage, Audit, Documentation, Conversation) give you every lens you need: health, structure, quality, usage, dependencies, history, and context. Together, this makes the Assets page the single source of truth for understanding what data you have, how trustworthy it is, and how it all connects.
The detail view provides the following tabs whenever it is applicable along with any other custom tab the user creates.
A summary of key metrics, recent alerts, and asset information at a glance. Start here to assess the current health of an asset.
A summary of an asset's child objects (e.g. Attribute under Table, Schema under Database) with relevant information for assessing structure.
Time-series charts and current values for all data observability and data quality metrics configured on the asset, such as completeness, uniqueness, volume and freshness.
Query activity, performance, and cost metrics for the asset, with a detailed query log showing the upstream sources and downstream consumers so you can trace the blast radius of an issue.
An interactive lineage graph showing the upstream sources and downstream consumers of the asset, so you can trace the blast radius of a data quality issue.
Chronological log of who did what and when on the asset (views, edits, and other actions), useful for tracking activity and governance.
Free-form documentation attached to the asset — descriptions, usage notes, and links — to help your team understand the data.
A discussion space for the asset where users can start topics, ask questions, and engage with likes/dislikes and bookmarks for team collaboration.
The Assets page provides a single, consistent entry point for discovering and managing every object in your data ecosystem — regardless of source platform. The asset type taxonomy ensures consistent classification across systems, while the detail tabs (Overview, Attributes, Metric, Usage, Lineage, Audit, Documentation, Conversation) give users the specific information needed to assess an asset's health, structure, quality, usage patterns, dependencies, change history, and business context. Together, these capabilities make the Assets page the central reference point for understanding what data exists, how reliable it is, and how it connects to the rest of the data ecosystem.