> ## Documentation Index
> Fetch the complete documentation index at: https://docs.dqlabs.ai/llms.txt
> Use this file to discover all available pages before exploring further.
# Get up and running with PRIZM: a step-by-step guide
> Learn how to sign in to PRIZM with your email, and create a new account from the login screen.
This guide walks you through your first session in PRIZM. You'll sign in, orient yourself in the dashboard, find a data asset, explore its details, and check whether any alerts or issues need your attention. The whole process takes about five minutes.
Open your PRIZM instance URL in a browser. On the login screen, enter your **Email**, then click **Login**.
If you don't have an account yet, please contact your **Administrator** below for an account to be created. Once authenticated, PRIZM redirects you to the Asset discovery page—or to the home page you have chosen to reach upon logging in.
PRIZM supports passwordless token based access with Multi-Factor Authentication apart from Enterprise SSO support.
After signing in, you land on the **Asset**—your starting point for exploring the platform. The header gives you everything you need to move around:
* **Assets**, **Metrics**, **Alerts**, and **Issues** appear as primary navigation items.
* Click **More** to access additional sections such as **Analytics, Product, Glossary and many more**.
* Use the **Search** bar on the right side of the header to find any asset by name. Press **⌘K** (Mac) or **Ctrl+K** (Windows/Linux) to focus the search field from anywhere in the platform.
Click **Assets** in the header to open the asset catalog. Use the search bar to find assets by name across all connected databases and platforms.
 Filter results using the asset type tabs that is sorted by default based on the number of items
| Tab | What It Shows |
| :------------ | :-------------------------------------------------------------- |
| **ALL** | Every asset across all types |
| **ATTRIBUTE** | Individual fields/columns belonging to a data asset |
| **MODEL** | Logical or semantic data models defined in Prizm |
| **TEST** | Data quality and validation test definitions |
| **WAREHOUSE** | Data warehouse connections/instances (e.g. Snowflake, Redshift) |
| **DATABASE** | Database objects within a warehouse |
| **ACCOUNT** | Platform or service account level entities |
| **EXPOSURE** | Downstream consumers of data (dashboards, apps, reports) |
| **DASHBOARD** | BI/visualization dashboards connected to data assets |
| **WORKBOOK** | Workbooks containing multiple dashboards or sheets |
| **SITE** | Top-level platform site (e.g. a Tableau site) |
| **SEED** | Static reference/lookup data files (e.g. CSV seeds) |
| **QUERY** | Saved queries for reuse and lineage tracking |
| **PIPELINE** | ETL and data pipelines (lineage & monitoring) |
| **REPORTS** | Report assets published to end users |
| **SEMANTICS** | Semantic models and metric/KPI definitions |
DQLabs Prizm catalogs assets across the **full data stack** — from raw ingestion sources and warehouse connections, through transformation layers (models, views, pipelines), all the way to consumption layer assets like dashboards, workbooks, and reports — with data quality tests and jobs tracked throughout.
Filter results using the asset type tabs that is sorted by default based on the number of items
| Tab | What It Shows |
| :------------ | :-------------------------------------------------------------- |
| **ALL** | Every asset across all types |
| **ATTRIBUTE** | Individual fields/columns belonging to a data asset |
| **MODEL** | Logical or semantic data models defined in Prizm |
| **TEST** | Data quality and validation test definitions |
| **WAREHOUSE** | Data warehouse connections/instances (e.g. Snowflake, Redshift) |
| **DATABASE** | Database objects within a warehouse |
| **ACCOUNT** | Platform or service account level entities |
| **EXPOSURE** | Downstream consumers of data (dashboards, apps, reports) |
| **DASHBOARD** | BI/visualization dashboards connected to data assets |
| **WORKBOOK** | Workbooks containing multiple dashboards or sheets |
| **SITE** | Top-level platform site (e.g. a Tableau site) |
| **SEED** | Static reference/lookup data files (e.g. CSV seeds) |
| **QUERY** | Saved queries for reuse and lineage tracking |
| **PIPELINE** | ETL and data pipelines (lineage & monitoring) |
| **REPORTS** | Report assets published to end users |
| **SEMANTICS** | Semantic models and metric/KPI definitions |
DQLabs Prizm catalogs assets across the **full data stack** — from raw ingestion sources and warehouse connections, through transformation layers (models, views, pipelines), all the way to consumption layer assets like dashboards, workbooks, and reports — with data quality tests and jobs tracked throughout.
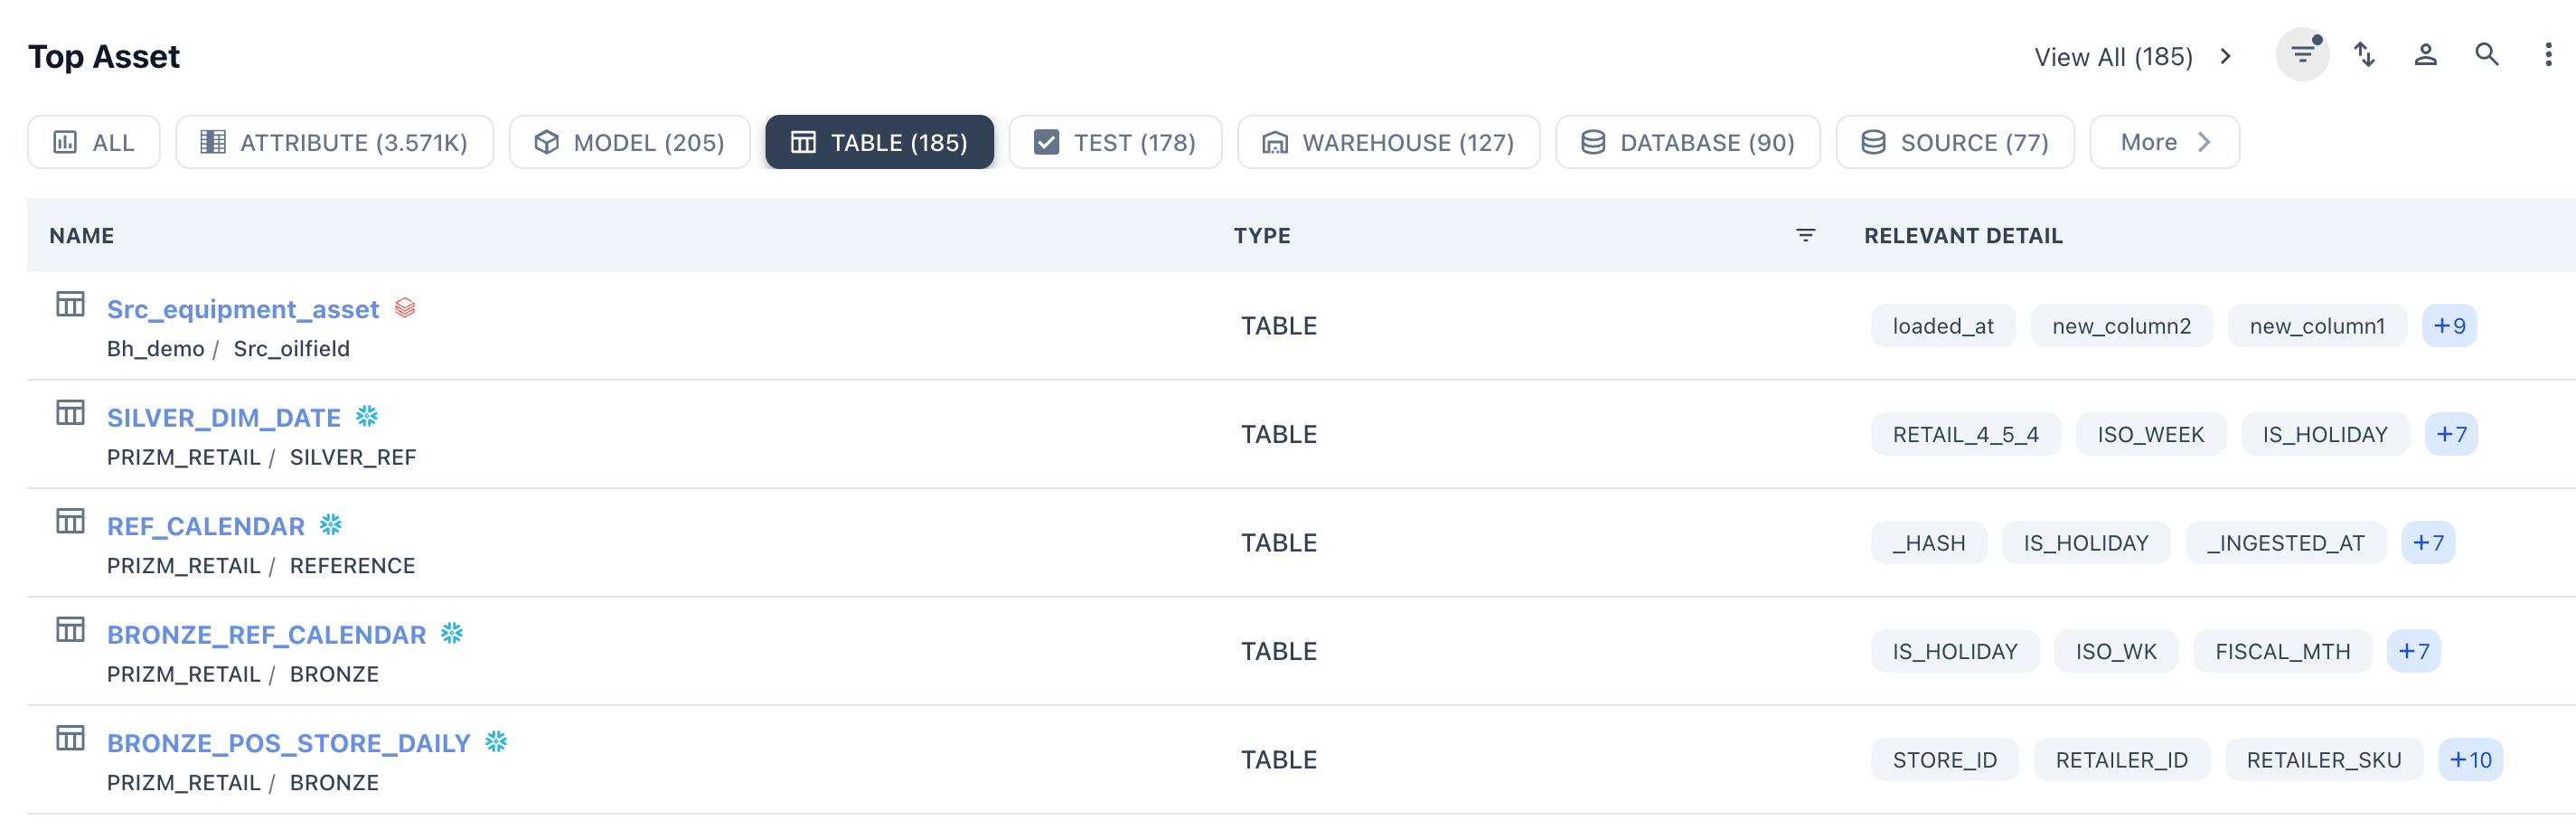 Assets are listed with their source database, schema (for example, `snowflake-db/production_schema `or `postgres_db/analytics_schema`) and associated columns.
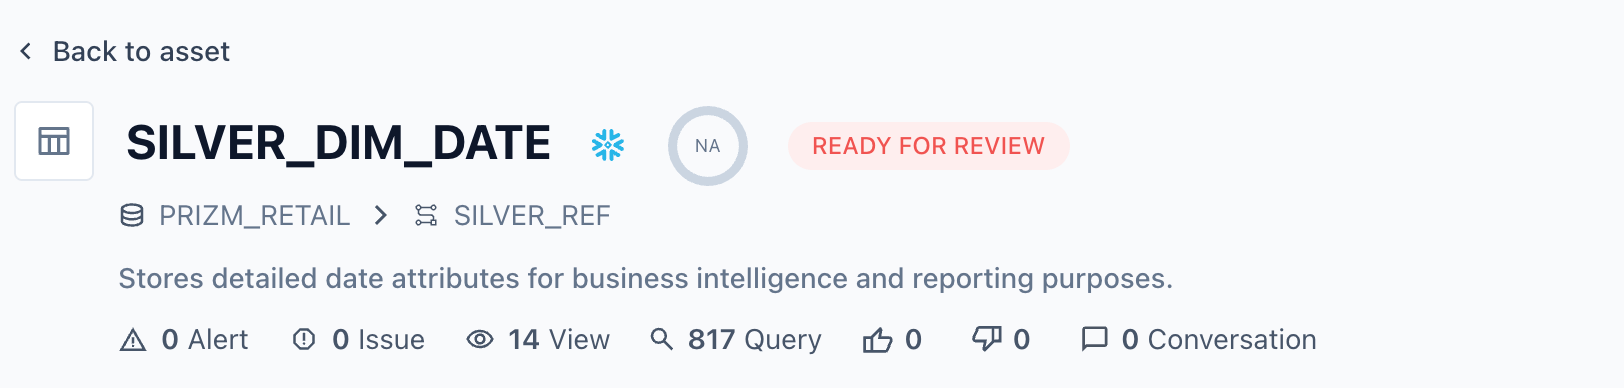
Click any asset in the list to open its detail page. The detail view shows the asset's description, source, owners, last-updated date, and quality tags. Use the tabs to explore different aspects of the asset:
* **Overview** — Summary of the asset at a glance includes volume trends, schema column count, freshness status, and overall data quality score. Also surfaces any recent alerts, issues, and quick metadata like owner and classification.
* **Attribute** — Column-level view of the asset's structure — lists every attribute/field with its data type, nullability, sample values, and individual quality profiling stats like uniqueness, completeness, and value distribution.
* **Metric** — Data quality metrics collected for this asset over time — tracks dimensions such as completeness, accuracy, consistency, and timeliness. Displays historical trend charts so you can spot degradation or anomalies across runs.
* **Usage** — Tracks how this asset is being consumed — shows query frequency, active users, and access patterns. Helps identify whether the asset is heavily used, stale, or orphaned. The **Query** count visible in the header feeds into this tab.
* **Lineage** — Visual map of upstream and downstream data dependencies — shows where data comes from (source tables, pipelines) and where it flows to (models, dashboards, reports). Useful for impact analysis when a schema or data change is planned.
* **Audit** — Change history and access log for the asset — records who viewed, edited, or certified the asset and when. Useful for governance, compliance, and tracking metadata changes over time.
* **Documentation** — Free-form and structured reference documentation linked to the asset — includes descriptions, business definitions, ownership notes, tags, and any linked wiki or external docs. Supports data literacy and self-service discovery.
* **Conversation** — Collaborative discussion thread attached to the asset — team members can ask questions, leave comments, flag concerns, or discuss data issues directly in context without leaving the platform. The **Conversation** count in the header reflects no active threads yet.
Click **Back to Assets** at the top left to return to the catalog.
Click **Alerts** in the header to see all active notifications. Alerts are categorized by severity—**Critical**, **High**, **Warning**, and **Info**—and include details such as the affected asset, drift status, and percent change.
Click **Issues** to see open data quality problems across your environment. Each issue shows the affected asset, database, priority level, and current status (New, In Progress, or Resolved). Use this view to triage and track problems to completion.
Assets are listed with their source database, schema (for example, `snowflake-db/production_schema `or `postgres_db/analytics_schema`) and associated columns.
Click any asset in the list to open its detail page. The detail view shows the asset's description, source, owners, last-updated date, and quality tags. Use the tabs to explore different aspects of the asset:
* **Overview** — Summary of the asset at a glance includes volume trends, schema column count, freshness status, and overall data quality score. Also surfaces any recent alerts, issues, and quick metadata like owner and classification.
* **Attribute** — Column-level view of the asset's structure — lists every attribute/field with its data type, nullability, sample values, and individual quality profiling stats like uniqueness, completeness, and value distribution.
* **Metric** — Data quality metrics collected for this asset over time — tracks dimensions such as completeness, accuracy, consistency, and timeliness. Displays historical trend charts so you can spot degradation or anomalies across runs.
* **Usage** — Tracks how this asset is being consumed — shows query frequency, active users, and access patterns. Helps identify whether the asset is heavily used, stale, or orphaned. The **Query** count visible in the header feeds into this tab.
* **Lineage** — Visual map of upstream and downstream data dependencies — shows where data comes from (source tables, pipelines) and where it flows to (models, dashboards, reports). Useful for impact analysis when a schema or data change is planned.
* **Audit** — Change history and access log for the asset — records who viewed, edited, or certified the asset and when. Useful for governance, compliance, and tracking metadata changes over time.
* **Documentation** — Free-form and structured reference documentation linked to the asset — includes descriptions, business definitions, ownership notes, tags, and any linked wiki or external docs. Supports data literacy and self-service discovery.
* **Conversation** — Collaborative discussion thread attached to the asset — team members can ask questions, leave comments, flag concerns, or discuss data issues directly in context without leaving the platform. The **Conversation** count in the header reflects no active threads yet.
Click **Back to Assets** at the top left to return to the catalog.
Click **Alerts** in the header to see all active notifications. Alerts are categorized by severity—**Critical**, **High**, **Warning**, and **Info**—and include details such as the affected asset, drift status, and percent change.
Click **Issues** to see open data quality problems across your environment. Each issue shows the affected asset, database, priority level, and current status (New, In Progress, or Resolved). Use this view to triage and track problems to completion.
 ## What's next
Learn how PRIZM discovers and catalogs tables, views, queries, pipelines, and semantic models.
Understand how alerts are generated, classified by severity, and linked to assets.
Learn how to manage data quality issues from discovery through resolution.
Use natural language to ask questions about your data directly inside PRIZM.
## What's next
Learn how PRIZM discovers and catalogs tables, views, queries, pipelines, and semantic models.
Understand how alerts are generated, classified by severity, and linked to assets.
Learn how to manage data quality issues from discovery through resolution.
Use natural language to ask questions about your data directly inside PRIZM.