> ## Documentation Index
> Fetch the complete documentation index at: https://docs.dqlabs.ai/llms.txt
> Use this file to discover all available pages before exploring further.
# What Prizm Collects from Databricks
> Complete field-level breakdown of every metadata object, quality metric, and signal Prizm extracts from Databricks Unity Catalog across all platform jobs.
Prizm runs the following platform jobs against each Databricks connector. Each job has a defined type, execution flow, and purpose. Select a job below to see the details.
| Property | Value |
| :------------ | :---------------------------------------------------------------------- |
| **Type** | CONTEXT |
| **Execution** | Runs immediately after source is configured — first job in the pipeline |
**What this job does:** Extracts catalogs, schemas, and top-level structural metadata from the Databricks Unity Catalog. This is the foundation job — all subsequent jobs depend on it completing successfully. Without a successful TECHNICAL run, no other job can start.
| Object | Fields Collected | Databricks Source |
| :---------- | :---------------------------------------------------------------------------------------------------------------------------------------- | :-------------------------------------- |
| **Catalog** | name, owner, comment, metastore\_id, created\_at, updated\_at | `GET /api/2.1/unity-catalog/catalogs` |
| **Schema** | schema\_name, catalog\_name, schema\_owner, comment, created, last\_altered | `.information_schema.schemata` |
| **Table** | table\_name, table\_type, schema\_name, catalog\_name, table\_owner, comment, created, last\_altered, data\_source\_format, storage\_path | `.information_schema.tables` |
| **View** | Same as Table + view\_definition | `.information_schema.views` |
| **Column** | column\_name, data\_type, ordinal\_position, is\_nullable, column\_default, comment, partition\_index, mask\_function\_name | `.information_schema.columns` |
Prizm catalogs Managed Tables, External Tables, and Views from Unity Catalog. Delta Live Tables and Jobs/Pipelines are discoverable when the Pipeline asset type is enabled in the connector settings.
| Property | Value |
| :------------ | :------------------------------- |
| **Type** | CONTEXT / TRUST |
| **Execution** | Starts after TECHNICAL completes |
**What this job does:** Extracts volume, freshness, and schema change signals for all in-scope table assets from Databricks metadata. Serves a dual purpose — it feeds the Prizm catalog (CONTEXT) and the alerting and anomaly detection pipeline (TRUST). It is the source of all time-series observability signals in Prizm and the upstream dependency for most parallel jobs.
| Signal | Source | Description |
| :----------------------------- | :----------------------------------------- | :----------------------------------------------------------------- |
| **Volume** | `information_schema.tables.row_count` | Row count trend; anomaly alerts on drops/spikes |
| **Freshness (Managed Table)** | `DESCRIBE HISTORY LIMIT 1` | Latest Delta commit timestamp — captures data writes, not just DDL |
| **Freshness (External Table)** | `DESCRIBE DETAIL ` → `lastModified` | Last modification timestamp from the external storage layer |
| **Schema Change** | `information_schema.tables.last_altered` | Column additions, renames, type changes, removals |
Anomaly detection uses adaptive forecasting models (EWMA, AutoReg, Prophet, SARIMAX) selected automatically based on each metric's historical pattern. Thresholds are recalculated after every run. A minimum of 5 historical values is required before alerts begin firing.
| Property | Value |
| :------------ | :------------------------------------------- |
| **Type** | CONTEXT |
| **Execution** | Runs in parallel after OPERATIONAL completes |
**What this job does:** Extracts table-level and column-level lineage from Databricks Unity Catalog system tables. Lineage extraction is event-driven — triggered only when a DDL change is detected on an asset (i.e., when `LAST_ALTERED` changes), keeping extraction efficient with no redundant per-hour runs.
| Direction | Source Table | Fields |
| :----------------------- | :----------------------------- | :----------------------------------------------------------------------------------------------------------------- |
| **Table-level lineage** | `system.access.table_lineage` | source\_table\_full\_name, target\_table\_full\_name, dependency\_type (DIRECT / TRANSITIVE), event\_time |
| **Column-level lineage** | `system.access.column_lineage` | source\_table\_full\_name, source\_column\_name, target\_table\_full\_name, target\_column\_name, dependency\_type |
| Direction | What Prizm Shows |
| :------------- | :----------------------------------------------------- |
| **Upstream** | Tables and views this asset reads from |
| **Downstream** | Tables, views, and pipelines that depend on this asset |
Access to `system.access.table_lineage` and `system.access.column_lineage` requires `SELECT` grants on those system tables. These tables are populated by Unity Catalog's built-in lineage tracking — no additional Databricks configuration is required beyond the permission grant.
| Property | Value |
| :------------ | :------------------------------------------- |
| **Type** | CONTEXT |
| **Execution** | Runs in parallel after OPERATIONAL completes |
**What this job does:** Extracts warehouse usage, compute costs, and query statistics for the previous 24 hours. Powers the Usage and Performance views in the Prizm asset detail page. This job is **disabled by default** and must be explicitly enabled in the connector settings. Requires `SELECT` on `system.query.history` and `system.billing.usage`.
| Category | Metrics | Source |
| :------------------------ | :--------------------------------------------------------------------------------------------------------- | :--------------------- |
| **Query Performance** | Execution time, bytes read, bytes written, result cache hit, Photon time, spill to disk, rows read/written | `system.query.history` |
| **Warehouse Utilization** | Total queries per warehouse, unique users, total execution hours, cache hit rate | `system.query.history` |
| **Billing & Cost** | Compute cost per query/job, storage cost per table, cost per domain, cost per user/role, cost per pipeline | `system.billing.usage` |
The Performance job is **disabled by default** and must be explicitly enabled per connector instance. Prizm retains time-series observability data, quality score history, and query usage history for a default window of **90 days**.
| Property | Value |
| :------------ | :------------------------------------------- |
| **Type** | CONTEXT |
| **Execution** | Runs in parallel after OPERATIONAL completes |
**What this job does:** Extracts summarized usage information and generates usage-based criticality inputs using 7 days of activity. Analyses how frequently each asset is queried, by whom, and with what patterns — then feeds those signals into the CRITICALITY RECOMMENDATION job. Assets with high query volume or many unique users are more likely to be recommended as critical.
| What It Produces | Description |
| :--------------------- | :----------------------------------------------------------------- |
| **Usage frequency** | Number of queries per asset over the past 7 days |
| **Unique user count** | Number of distinct users who accessed each asset |
| **Access patterns** | Read vs write activity, peak usage windows |
| **Criticality inputs** | Usage-based signals consumed by the CRITICALITY RECOMMENDATION job |
| Property | Value |
| :------------ | :------------------------------------------- |
| **Type** | CONTEXT |
| **Execution** | Runs in parallel after OPERATIONAL completes |
**What this job does:** Extracts governance metadata including tags and business metadata. Keeps Prizm's governance layer in sync with classifications, ownership, and tagging applied directly in Databricks Unity Catalog.
| Object | Fields Collected | Databricks Source |
| :---------------------- | :-------------------------------------------------------------------------------------- | :-------------------------------------- |
| **Tags (table-level)** | tag\_name, tag\_value, catalog\_name, schema\_name, table\_name | `system.information_schema.table_tags` |
| **Tags (column-level)** | tag\_name, tag\_value, table\_name, column\_name | `system.information_schema.column_tags` |
| **Stored Procedure** | routine\_name, routine\_type, return\_type, routine\_definition, created, last\_altered | `.information_schema.routines` |
| **Business metadata** | Owner, description, classification fields | `information_schema` object properties |
| Property | Value |
| :------------ | :------------------------------------------- |
| **Type** | CONTEXT |
| **Execution** | Runs in parallel after OPERATIONAL completes |
**What this job does:** Calculates and recommends criticality scores for assets and attributes. Criticality determines how much observability coverage an asset receives — higher criticality assets get more frequent monitoring, more structural metrics, and tighter alert thresholds. The output is a recommended criticality level (LOW, MEDIUM, HIGH, CRITICAL) per asset, which users can accept or override.
| Input Signal | Source Job |
| :----------------------------- | :---------------------- |
| Usage frequency and user count | USAGE SUMMARY |
| Downstream dependency count | LINEAGE |
| Business metadata completeness | GOVERNANCE |
| Asset type and schema position | TECHNICAL / OPERATIONAL |
| Property | Value |
| :------------ | :------------------------------------------- |
| **Type** | TRUST |
| **Execution** | Runs in parallel after OPERATIONAL completes |
**What this job does:** Computes non-metadata metrics such as freshness and volume for non-table assets by running direct queries against Databricks. The OPERATIONAL job derives signals from metadata — but for assets like views and external tables, metadata alone is not sufficient. COMPUTE METRIC fills this gap by executing lightweight queries to obtain accurate signals.
| Asset Type | What Is Computed | How |
| :-------------------- | :----------------------------------------- | :--------------------------------------------------- |
| **View** | Row count, freshness derived from upstream | Direct `SELECT COUNT(*)` and upstream lineage lookup |
| **External Table** | Row count, last modified | `DESCRIBE DETAIL` → `lastModified` |
| **Materialized View** | Row count, refresh timestamp | Query against materialized view metadata |
| Property | Value |
| :------------ | :-------------------------------------------------------------------- |
| **Type** | TRUST |
| **Execution** | Runs in parallel after OPERATIONAL; PROFILE job depends on its output |
**What this job does:** Recommends profiling schedules and configurations based on asset scope definitions. Determines which assets should be profiled, at what frequency, and with what sample settings — taking into account criticality level, asset size, and scope configuration. The PROFILE job will not run until this job has produced its output and created the schedules.
| Property | Value |
| :------------ | :----------------------------------------------------------------------- |
| **Type** | TRUST |
| **Execution** | Runs in parallel after OPERATIONAL; STRUCTURAL job depends on its output |
**What this job does:** Recommends structural quality metrics (Essential or Advanced) for each attribute. Analyses the column's data type, profile history, and criticality to determine the appropriate metric set. Essential metrics are always recommended; Advanced metrics are added for columns where deeper analysis is warranted. The STRUCTURAL job executes against this recommendation output.
| Property | Value |
| :------------ | :------------------------------------------------------------------------- |
| **Type** | TRUST |
| **Execution** | Triggered after PROFILE RECOMMENDATION completes and schedules are created |
**What this job does:** Executes profiling jobs according to the schedules generated by PROFILE RECOMMENDATION and stores the profiling results. Can also be triggered manually from the asset page at any time.
**Table-level metrics:**
| Metric | Description |
| :---------------------- | :----------------------------------------------------------------------------------------------- |
| **Row Count** | Total rows at profile time (from `information_schema.tables.row_count` with `COUNT(*)` fallback) |
| **Duplicate Row Count** | Rows that are exact duplicates of another row |
| **Completeness Score** | % of columns with non-null values across all rows |
**Column-level metrics:**
| Metric | Applicable Types | Description |
| :---------------------- | :---------------------- | :--------------------------------------------- |
| **Null Rate** | All | % of null values |
| **Distinct Count** | All | Number of unique non-null values (cardinality) |
| **Uniqueness Rate** | All | % of values appearing exactly once |
| **Min / Max** | Numeric, Date/Timestamp | Observed range of values |
| **Mean** | Numeric | Arithmetic mean |
| **Standard Deviation** | Numeric | Statistical spread |
| **Median** | Numeric | 50th percentile value |
| **Top N Values** | String, Boolean | Most frequent values and their counts |
| **Pattern Conformance** | String | % matching an expected regex format |
| **Type Conformance** | String | % of values castable to the declared data type |
**Trigger conditions:**
| Trigger | Conditions |
| :--------------------- | :-------------------------------------------------------------------------------------------------------------------------------------------- |
| **Scheduled run** | Active schedule, `next_run_at` is due, source is valid and active |
| **Manual run** | User triggers Profile from the asset UI (TABLE or VIEW) |
| **Criticality gating** | Only attributes eligible for the asset's criticality level are profiled |
| **Skip (incremental)** | Skipped if the table row count is unchanged since the last run, or if the existing profile is newer than the table's `last_altered` timestamp |
| Property | Value |
| :------------ | :-------------------------------------------------------------------------- |
| **Type** | TRUST |
| **Execution** | Triggered after STRUCTURAL RECOMMENDATION completes and metrics are created |
**What this job does:** Executes structural quality metrics according to the schedules and configurations generated by STRUCTURAL RECOMMENDATION. Computes distribution, frequency, pattern, and statistics metrics at the attribute level for all in-scope columns.
| Metric Category | What Is Computed |
| :--------------- | :-------------------------------------------------------------------------------------------------------- |
| **Distribution** | Null count, empty, space, distinct, repeating, character composition, leading/trailing/inner space |
| **Frequency** | Enum (value histogram), min/max value, value range, min/max length, length distribution |
| **Pattern** | Short pattern, long pattern, user-defined regular expressions |
| **Statistics** | Mean, median, mode, standard deviation, sum, Q1, Q3, range, skewness, kurtosis, variance, margin of error |
| Property | Value |
| :------------ | :-------------------------------------- |
| **Type** | CONTEXT |
| **Execution** | Independent job; no upstream dependency |
**What this job does:** Recommends asset definitions, descriptions, intended audience, semantic context, and execution scope settings (Incremental, Sampling with Filter, or None). Uses AI to analyse the asset's name, column names, sample values, and usage patterns to generate human-readable context that data stewards can review and accept.
| What It Generates | Description |
| :------------------- | :------------------------------------------------------------------------------------------ |
| **Description** | AI-generated plain-language description of what the asset contains and its purpose |
| **Who should use** | Recommended audience — data analysts, engineers, business users, etc. |
| **Semantic context** | Suggested domain, product, application, and tag classifications |
| **Execution scope** | Recommended profiling mode — Incremental (only changed rows), Sampling with Filter, or None |
| Property | Value |
| :------------ | :-------------------------------------- |
| **Type** | TRUST |
| **Execution** | Independent job; no upstream dependency |
**What this job does:** Recommends business metrics for assets based on column names, data types, profiling results, and industry patterns. Suggests quality checks that go beyond structural profiling — for example, a not-null check on a primary key column, or a range check on a revenue column. Recommendations appear in the Prizm UI for review before any metric is created.
| Property | Value |
| :------------ | :-------------------------------------- |
| **Type** | TRUST |
| **Execution** | Independent job; no upstream dependency |
**What this job does:** Recommends metric descriptions, purposes, and rationale for existing metrics. For each metric already defined on an asset, this job generates a human-readable explanation of what the metric checks, why it matters, and what a failure would indicate. These descriptions appear in the Prizm metric detail panel and help data stewards understand the intent behind auto-generated checks.
| Property | Value |
| :------------ | :-------------------------------------- |
| **Type** | CONTEXT |
| **Execution** | Independent job; no upstream dependency |
**What this job does:** Maps assets and attributes to existing glossary terms or generates new business terms where required. Analyses column names, descriptions, and sample values to find matching terms in the Prizm business glossary. Powers the Semantic layer in Prizm — ensuring that columns are aligned to approved business vocabulary.
| Output | Description |
| :------------------- | :--------------------------------------------------------------------------------------- |
| **Term mapping** | Links a column to an existing glossary term (e.g. `customer_id` → "Customer Identifier") |
| **Term proposal** | Suggests a new glossary term where no existing match is found |
| **Confidence score** | Indicates how confident the AI is in the mapping recommendation |
| Property | Value |
| :------------ | :-------------------------------------- |
| **Type** | TRUST |
| **Execution** | Independent job; no upstream dependency |
**What this job does:** Clusters and groups related alerts to reduce duplication and improve root-cause analysis. When multiple alerts fire simultaneously on the same asset or related assets — for example, a freshness alert and a volume alert on the same table — this job groups them into a single alert cluster. Reduces alert fatigue by surfacing correlated failures together rather than as separate notifications.
| Property | Value |
| :------------ | :-------------------------------------- |
| **Type** | TRUST |
| **Execution** | Independent job; no upstream dependency |
**What this job does:** Generates and refreshes daily asset trend data by aggregating DQ scores, alerts, issues, and asset metadata. Powers the score history charts on the asset detail page — the time-series view of how an asset's quality score has evolved over time. Also feeds domain-level and portfolio-level trend views in the Prizm Scorecard and Analytics pages.
| Property | Value |
| :------------ | :-------------------------------------- |
| **Type** | PLATFORM |
| **Execution** | Independent job; no upstream dependency |
**What this job does:** Cleans and maintains the Prizm repository by removing obsolete data. Deletes stale metric history, expired alert records, orphaned job artifacts, and data from deleted or disconnected sources. Runs on a configurable schedule to keep the Prizm database within the configured retention window. Does not affect live assets or active metric data within the retention period.
| Property | Value |
| :------------ | :------------------------------------------------------------------------------------------------------------------------------ |
| **Type** | CONTEXT / TRUST |
| **Execution** | Runs on a 15-minute polling interval when **Enable pipelines and jobs** is toggled on in the connector's Advanced Configuration |
**What this job does:** Discovers and monitors all in-scope Databricks Job, Workflow, Delta Live Table (DLT), and Lakeflow Pipeline objects. On first run it backfills run history for the configured lookback window (default 7 days). On subsequent runs it incrementally ingests new run events and flow-level telemetry, computes observability metrics, and fires alerts on failures, missed schedules, and data quality expectation violations.
**Pipeline catalog fields** (sourced from `system.lakeflow.job_runs` and the Databricks Jobs REST API):
| Field | Pipeline Types | Description |
| :--------------------------- | :------------------------------- | :------------------------------------------------------------------------------------------ |
| `workspace_id` | All | Databricks workspace identifier |
| `pipeline_id` / `job_id` | All | Unique identifier for the Job or DLT pipeline |
| `pipeline_name` / `job_name` | All | Display name |
| `creator_user_name` | Jobs, DLT, Procedures, Functions | Identity that created the pipeline |
| `run_as_user_name` | Jobs, Procedures | Service principal or user the pipeline runs as |
| `catalog_name` | All | Unity Catalog catalog the pipeline operates on |
| `schema_name` | DLT, Procedures, Functions | Target schema |
| `start_time` | Jobs, DLT, Tasks | Run start timestamp |
| `end_time` | Jobs, DLT, Tasks | Run end timestamp |
| `execution_duration` | Jobs, DLT, Tasks | Total elapsed time in milliseconds |
| `result_state` | Jobs, DLT, Tasks | Final run state: `SUCCESS`, `FAILED`, `CANCELLED`, `SKIPPED`, `EXCLUDED`, `STOPPED`, `IDLE` |
**Flow-level telemetry fields** (sourced from DLT event log — `flow_progress` events):
| Field | Description |
| :---------------------------------- | :------------------------------------------------------------ |
| `table_name` / `flow_name` | Name of the DLT flow (streaming table or materialized view) |
| `update_id` | DLT pipeline update identifier |
| `final_status` | Flow-level outcome (`COMPLETED`, `FAILED`, `CANCELLED`, etc.) |
| `total_output_records` | Rows written to the target in this update |
| `total_upserted_records` | Rows upserted (merge operations) |
| `total_deleted_records` | Rows deleted |
| `total_expectation_dropped_records` | Rows dropped due to DLT `EXPECT` constraint violations |
| `duration_seconds` | Flow-level execution time in seconds |
**DLT expectation (data quality) fields** (sourced from DLT event log — `flow_progress.data_quality`):
| Field | Description |
| :----------------- | :------------------------------------------------------ |
| `expectation_name` | Name of the `EXPECT` constraint |
| `dataset` | DLT table the expectation applies to |
| `passed_records` | Records that satisfied the expectation |
| `failed_records` | Records that violated the expectation |
| `dropped_records` | Records dropped when the expectation's action is `DROP` |
Pipeline collection requires **Enable pipelines and jobs** to be turned on in the connector's Advanced Configuration. The lookback window (default 7 days) controls how far back Prizm reaches on the initial sync. Subsequent runs are incremental.
## What You See in Prizm
Once Prizm completes its initial catalog and observability runs, every Databricks asset gets a unified detail page in the catalog. The sections below describe what each asset type shows.
## Table & View Asset Pages
Tables and views cataloged from Databricks Unity Catalog each get a dedicated asset detail page with the following tabs.
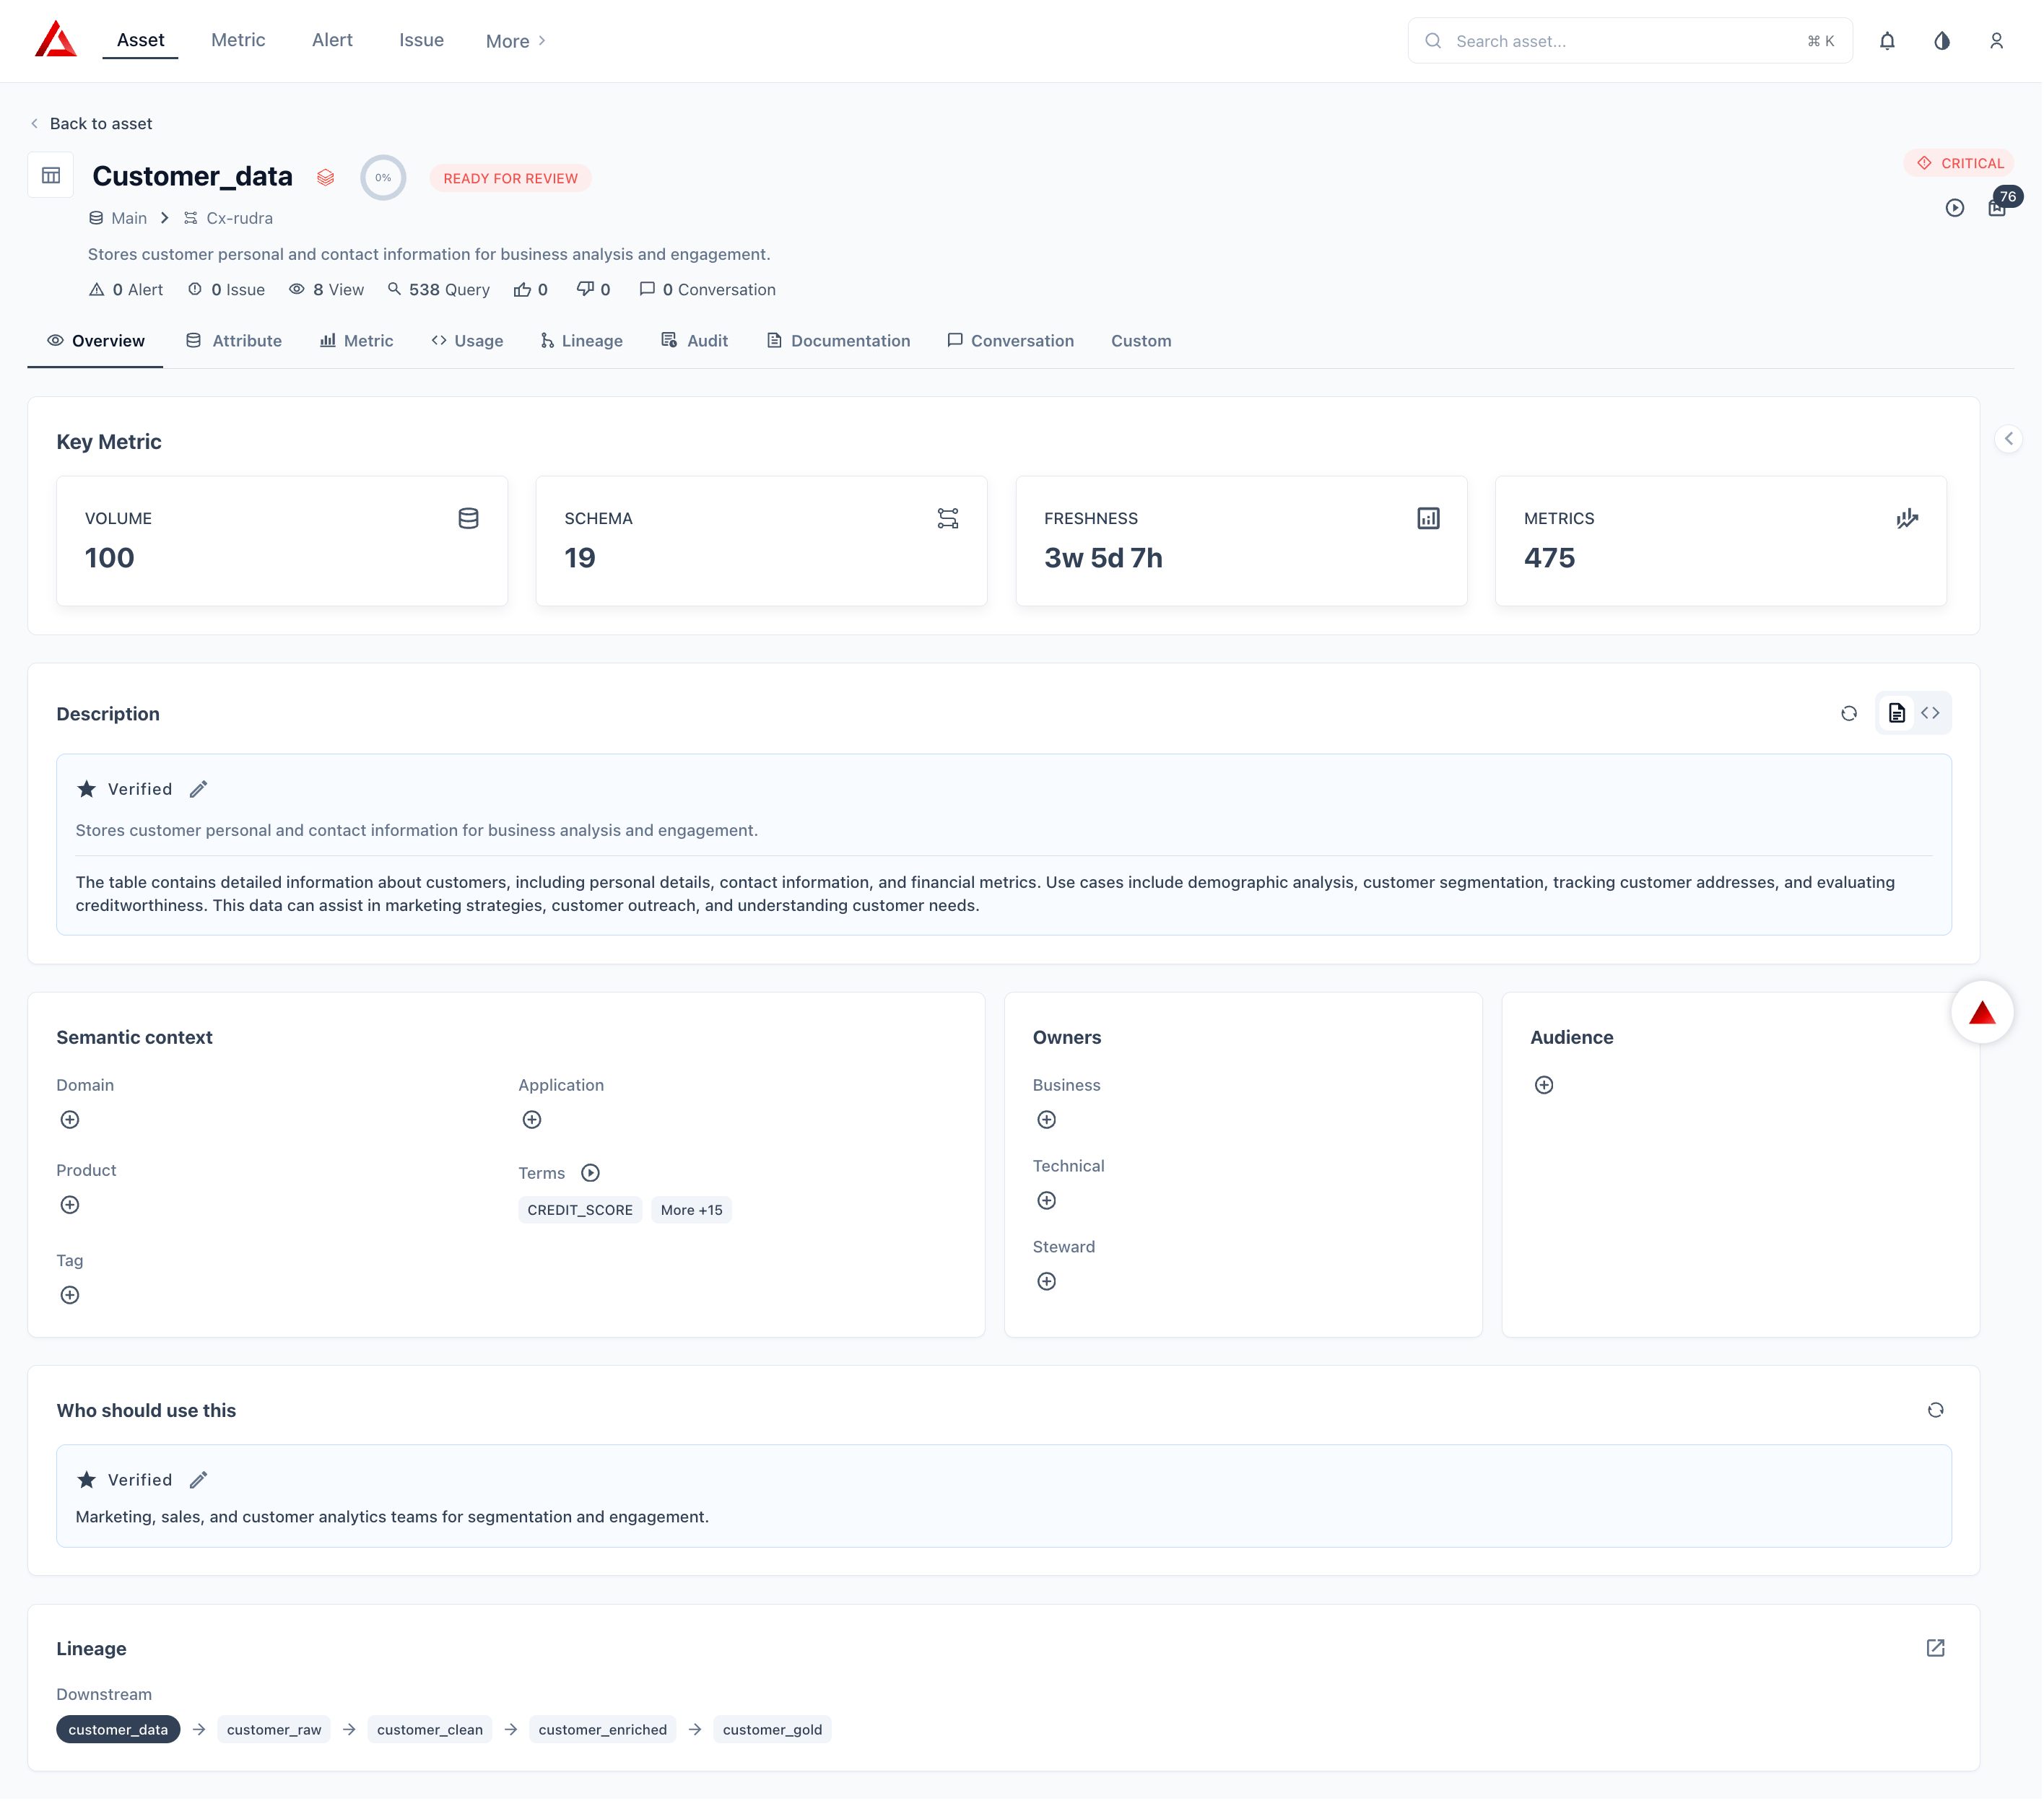 | **Section** | **What Prizm Shows** |
| :---------------------- | :--------------------------------------------------------------------------------------------------------------------- |
| **Quality Score** | Overall data quality percentage computed across all active metrics |
| **Status** | Review state (e.g., READY FOR REVIEW) and criticality badge |
| **Key Metrics** | VOLUME (row count), SCHEMA (column count), FRESHNESS (time since last update), METRICS (total quality metrics defined) |
| **Description** | AI-generated or manually verified description of the asset |
| **Semantic Context** | Domain, Application, Product, Tag, and Terms classifications |
| **Owners** | Business owner, Technical owner, and Steward contacts |
| **Audience** | Intended audience and recommended use cases |
| **Who should use this** | AI-generated guidance on which teams or roles should consume this asset |
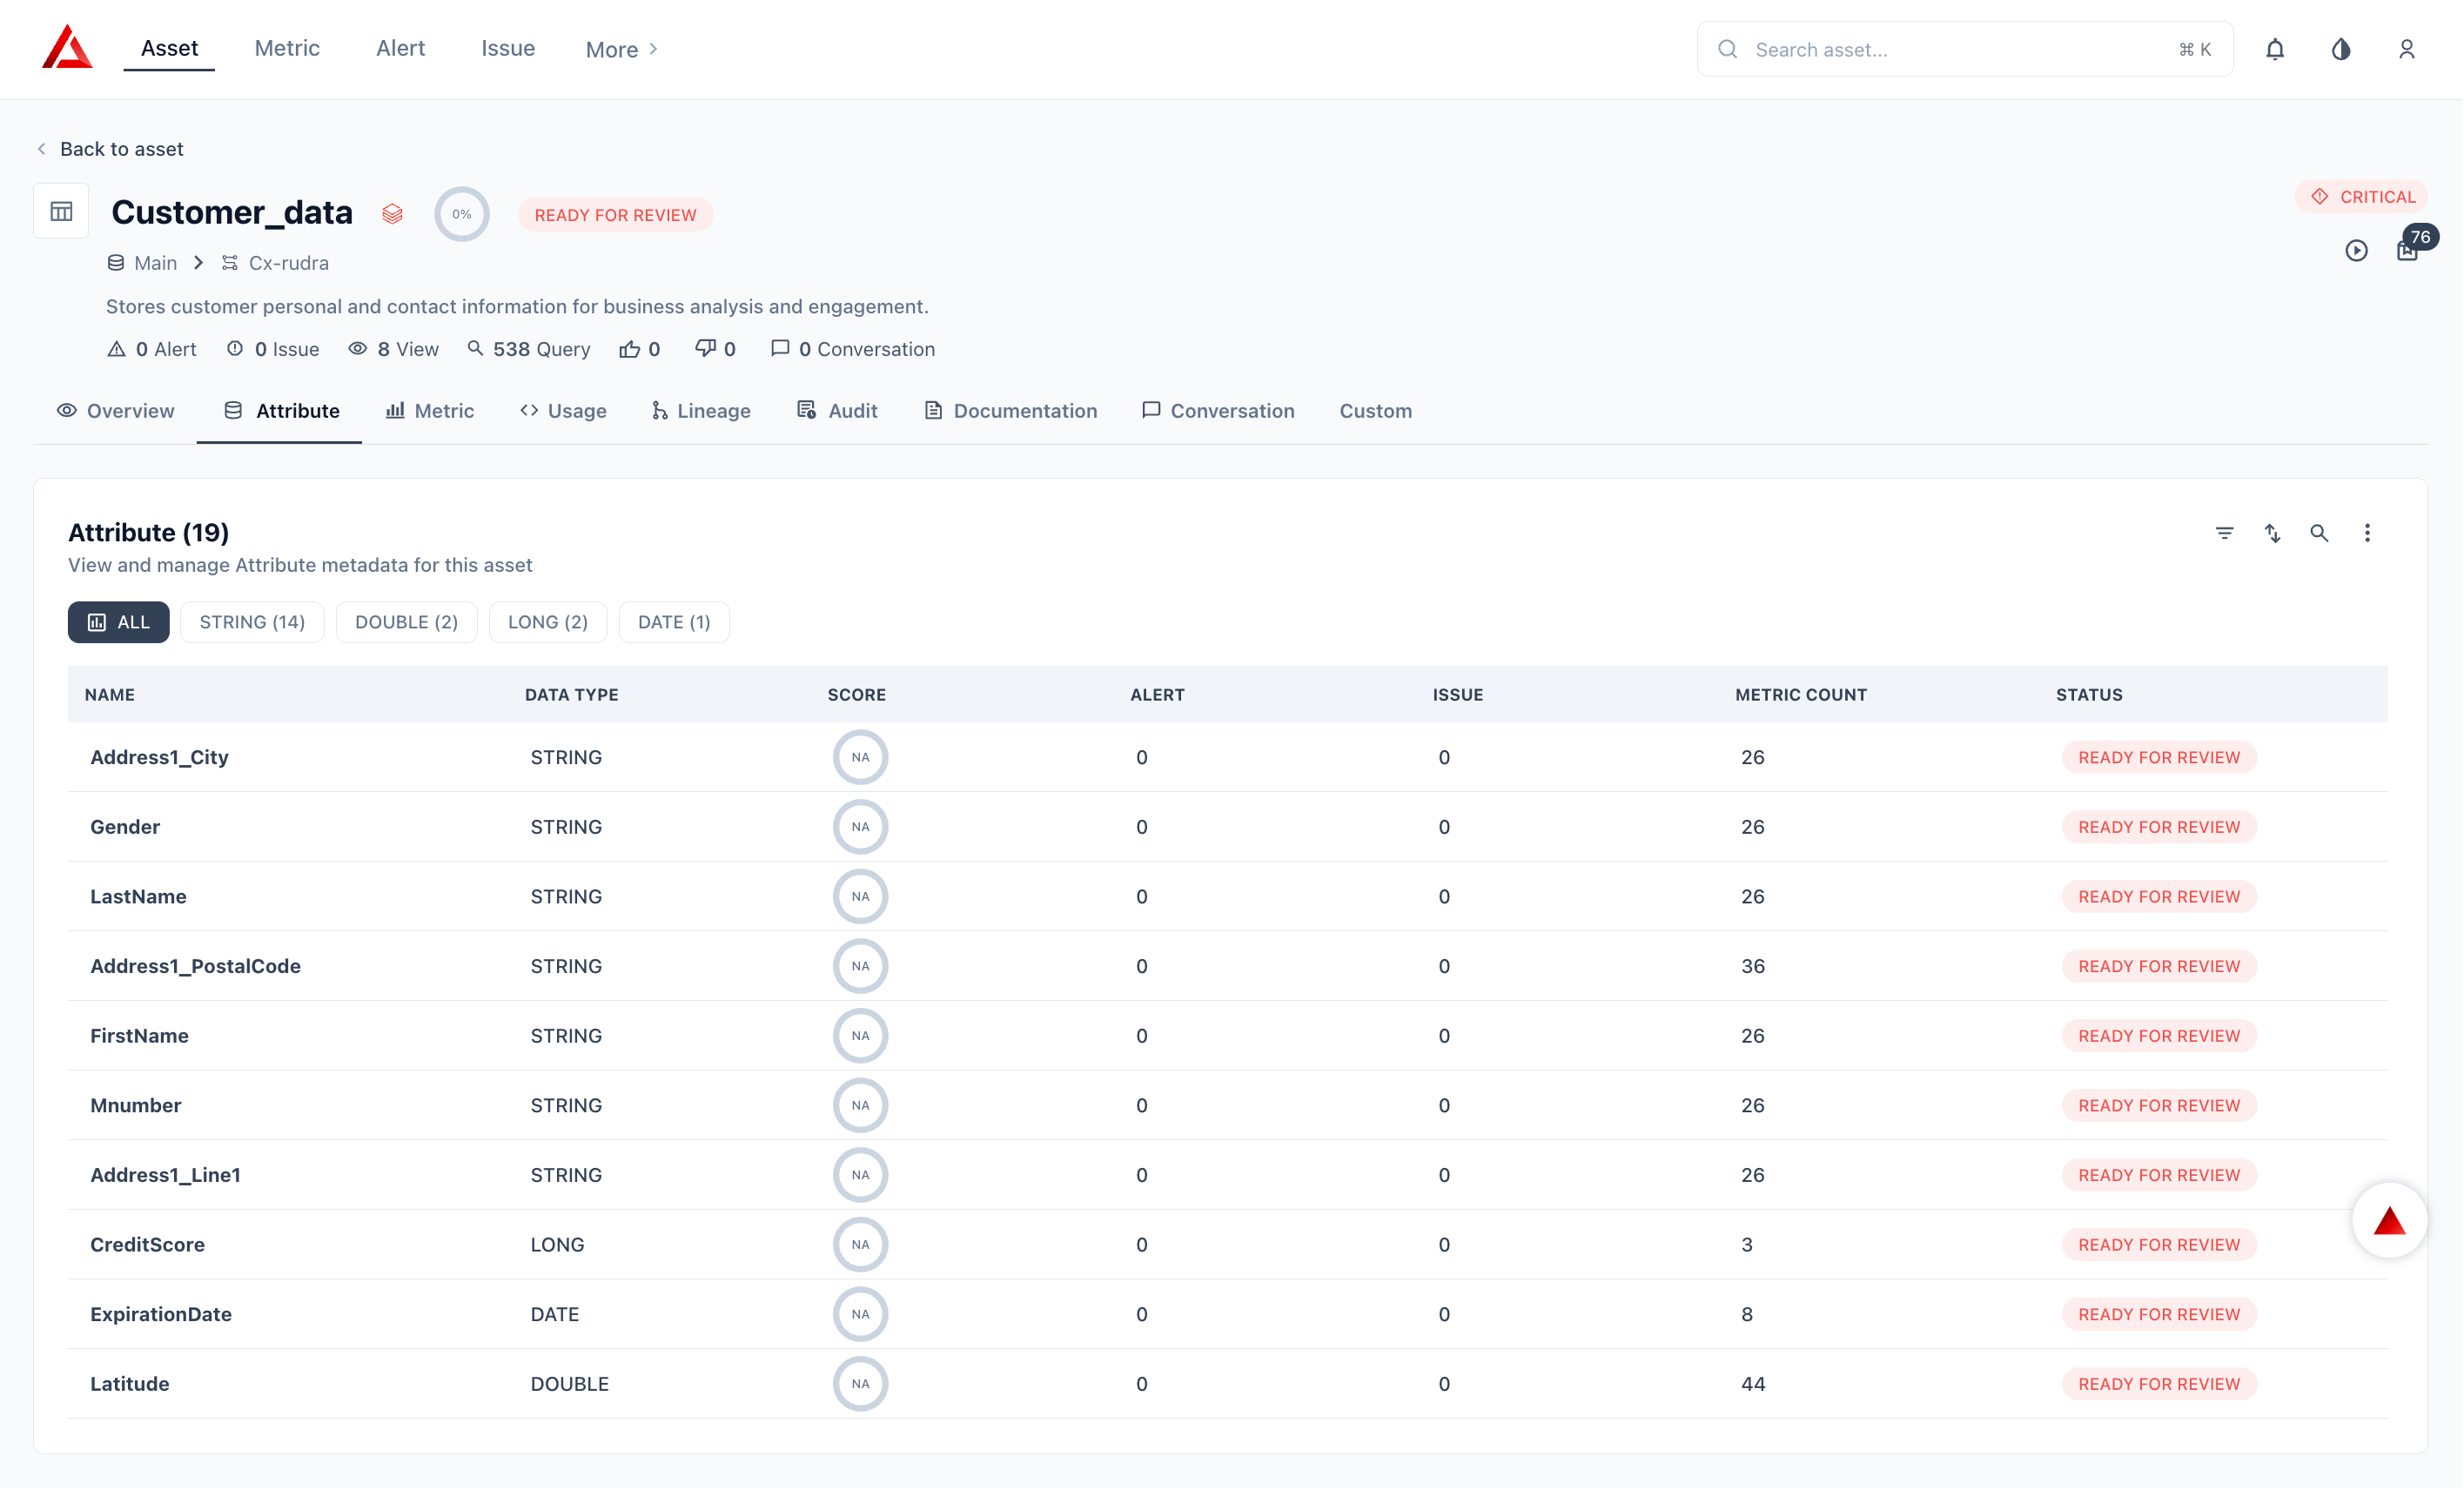
The Attribute tab lists every column Prizm has cataloged with columns: **NAME, DATA TYPE, SCORE, ALERT, ISSUE, METRIC COUNT, STATUS**.
| **Section** | **What Prizm Shows** |
| :---------------------- | :--------------------------------------------------------------------------------------------------------------------- |
| **Quality Score** | Overall data quality percentage computed across all active metrics |
| **Status** | Review state (e.g., READY FOR REVIEW) and criticality badge |
| **Key Metrics** | VOLUME (row count), SCHEMA (column count), FRESHNESS (time since last update), METRICS (total quality metrics defined) |
| **Description** | AI-generated or manually verified description of the asset |
| **Semantic Context** | Domain, Application, Product, Tag, and Terms classifications |
| **Owners** | Business owner, Technical owner, and Steward contacts |
| **Audience** | Intended audience and recommended use cases |
| **Who should use this** | AI-generated guidance on which teams or roles should consume this asset |
The Attribute tab lists every column Prizm has cataloged with columns: **NAME, DATA TYPE, SCORE, ALERT, ISSUE, METRIC COUNT, STATUS**.
 Clicking any attribute opens its column profile with views across completeness, uniqueness, character distribution, patterns, and frequency.
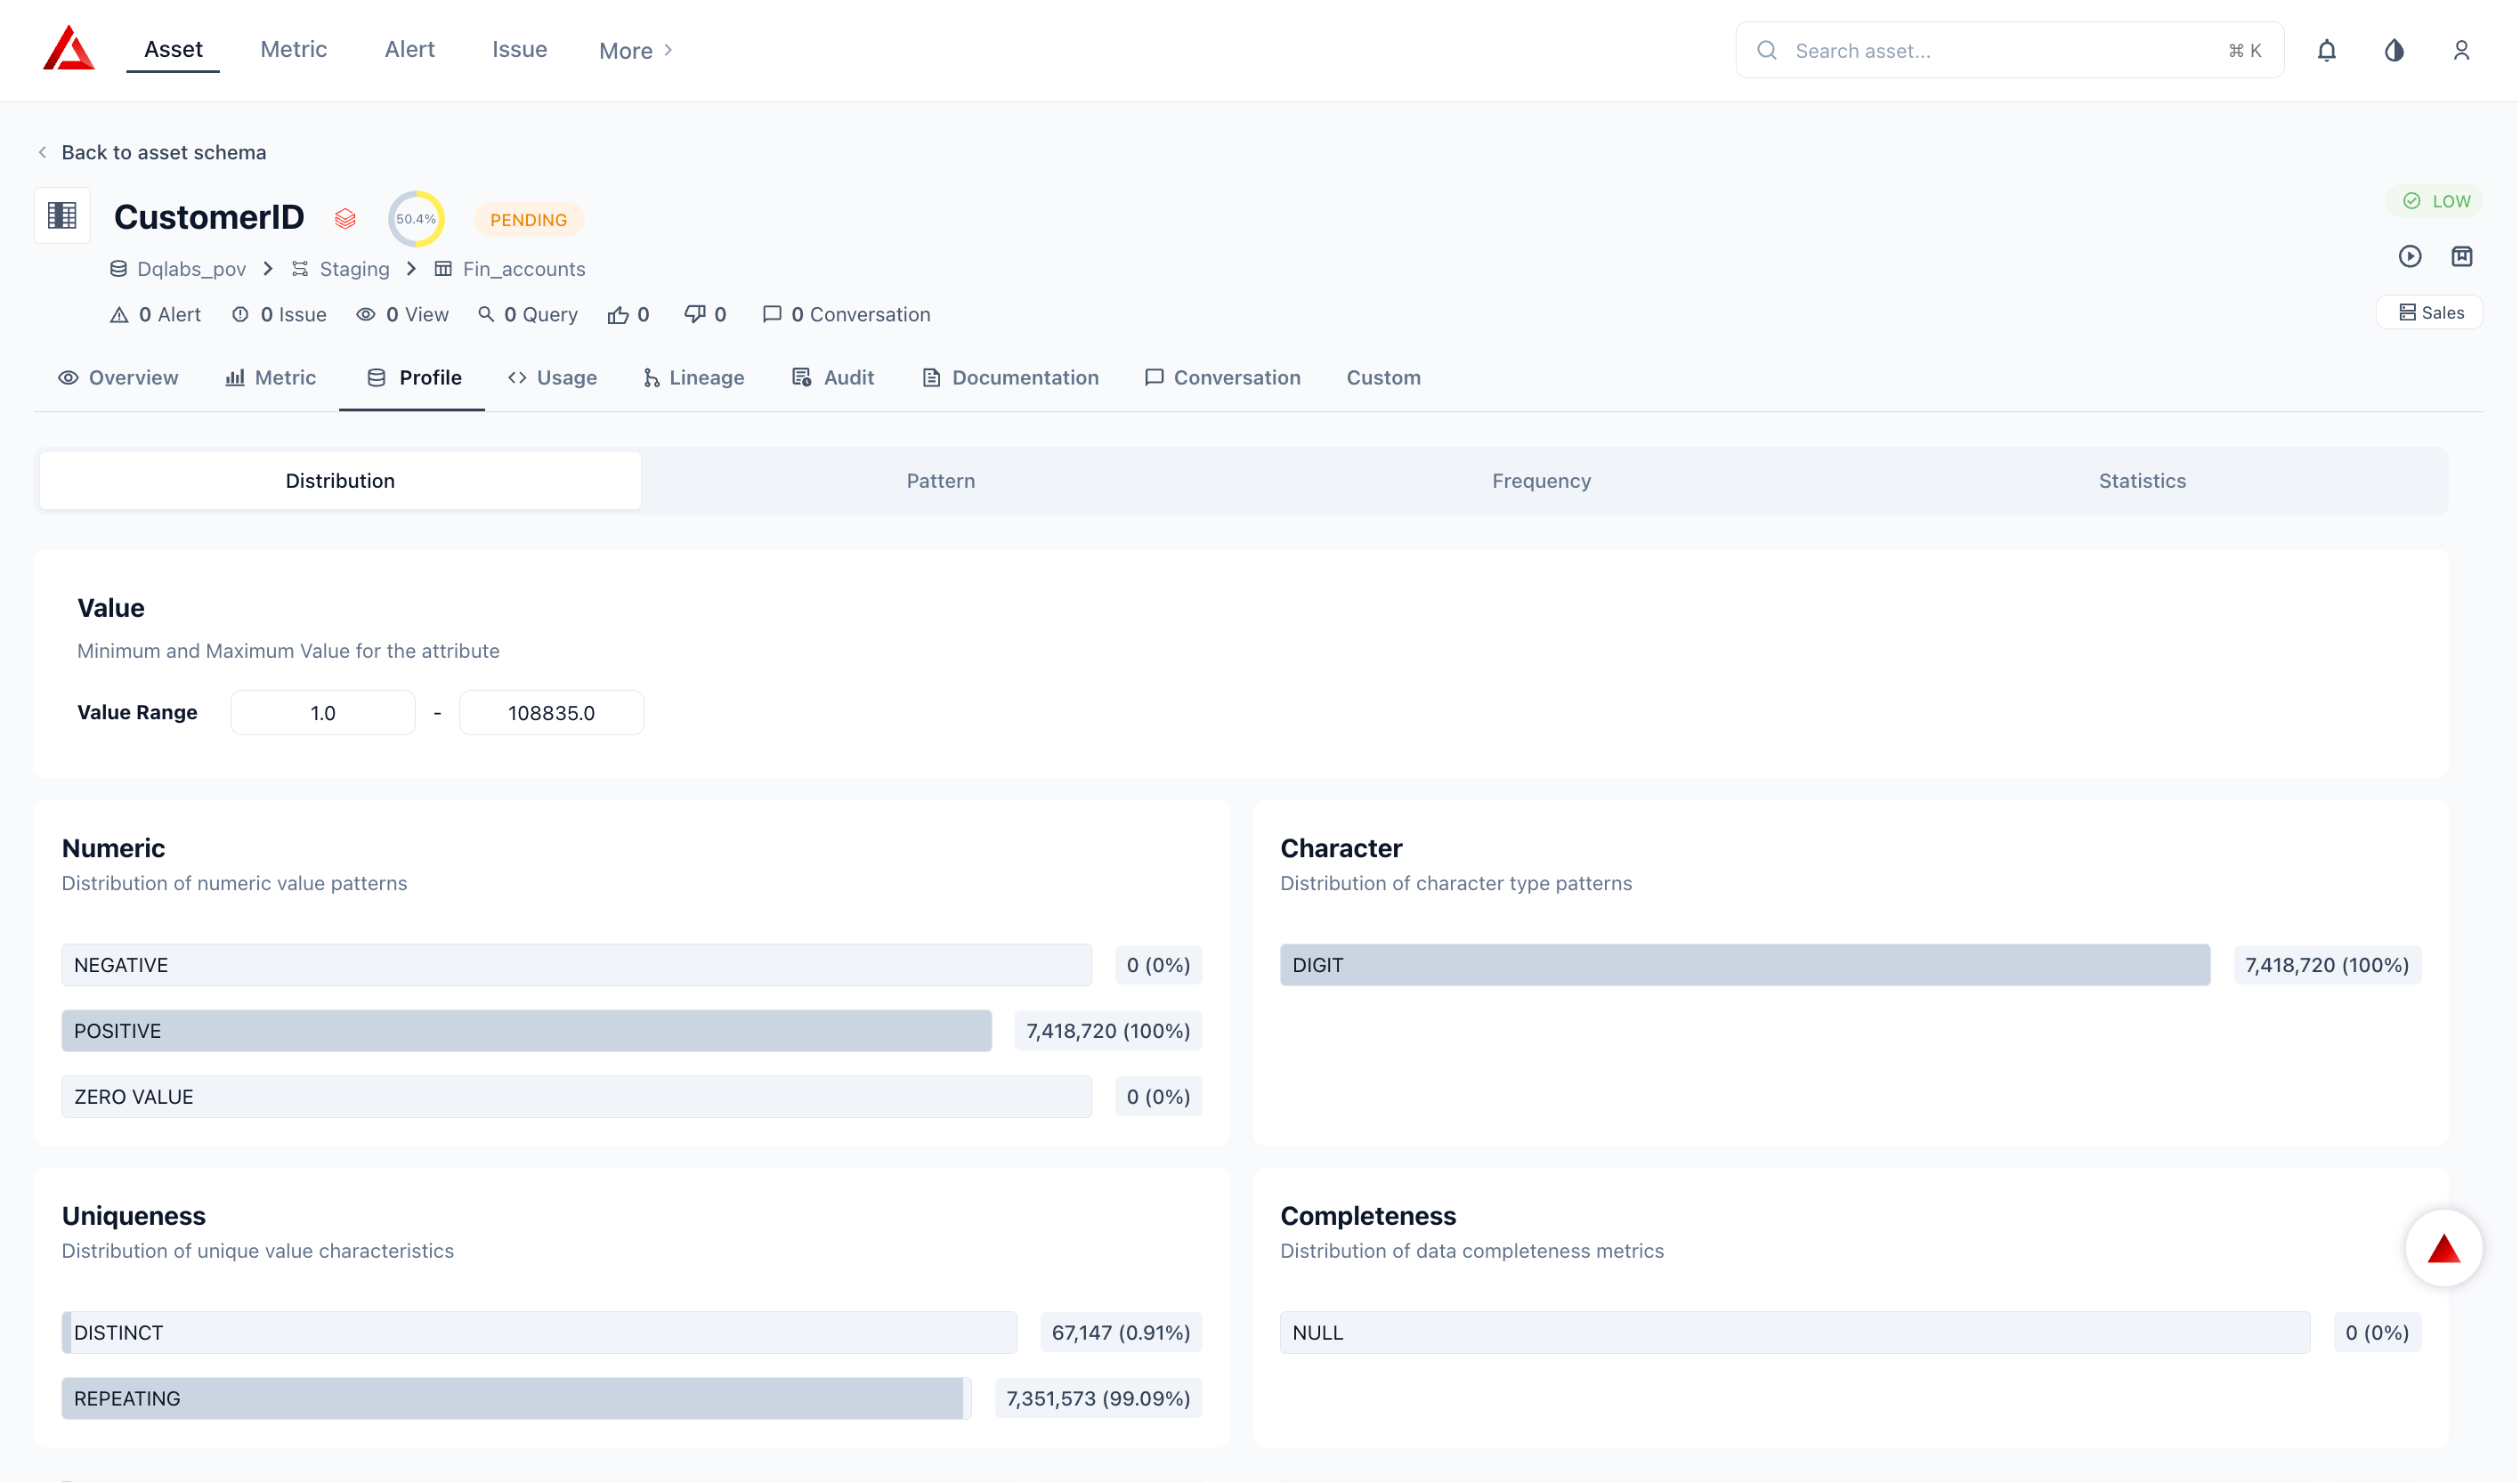 | **Profile Section** | **What Prizm Shows** |
| :------------------ | :-------------------------------------------------------------------- |
| **Completeness** | Count and % of NULL, EMPTY, SPACE, and NON-EMPTY values |
| **Uniqueness** | Count and % of DISTINCT vs REPEATING values |
| **Character** | Distribution across DIGIT, ALPHABET, ALPHA NUMERIC, SPECIAL CHARACTER |
| **Length** | Minimum and maximum character length |
| **Pattern** | Top regex patterns detected across values |
| **Frequency** | Most and least frequent individual values |
For the full breakdown of profiling views, metric types, and how to interpret profile results, see the [Data Profiling](/data-profiling) section.
The Metric tab lists all quality metrics defined on the asset. Each row shows the metric name, asset/column name, domain, current score, alert count, issue count, and action controls.
| **Profile Section** | **What Prizm Shows** |
| :------------------ | :-------------------------------------------------------------------- |
| **Completeness** | Count and % of NULL, EMPTY, SPACE, and NON-EMPTY values |
| **Uniqueness** | Count and % of DISTINCT vs REPEATING values |
| **Character** | Distribution across DIGIT, ALPHABET, ALPHA NUMERIC, SPECIAL CHARACTER |
| **Length** | Minimum and maximum character length |
| **Pattern** | Top regex patterns detected across values |
| **Frequency** | Most and least frequent individual values |
For the full breakdown of profiling views, metric types, and how to interpret profile results, see the [Data Profiling](/data-profiling) section.
The Metric tab lists all quality metrics defined on the asset. Each row shows the metric name, asset/column name, domain, current score, alert count, issue count, and action controls.
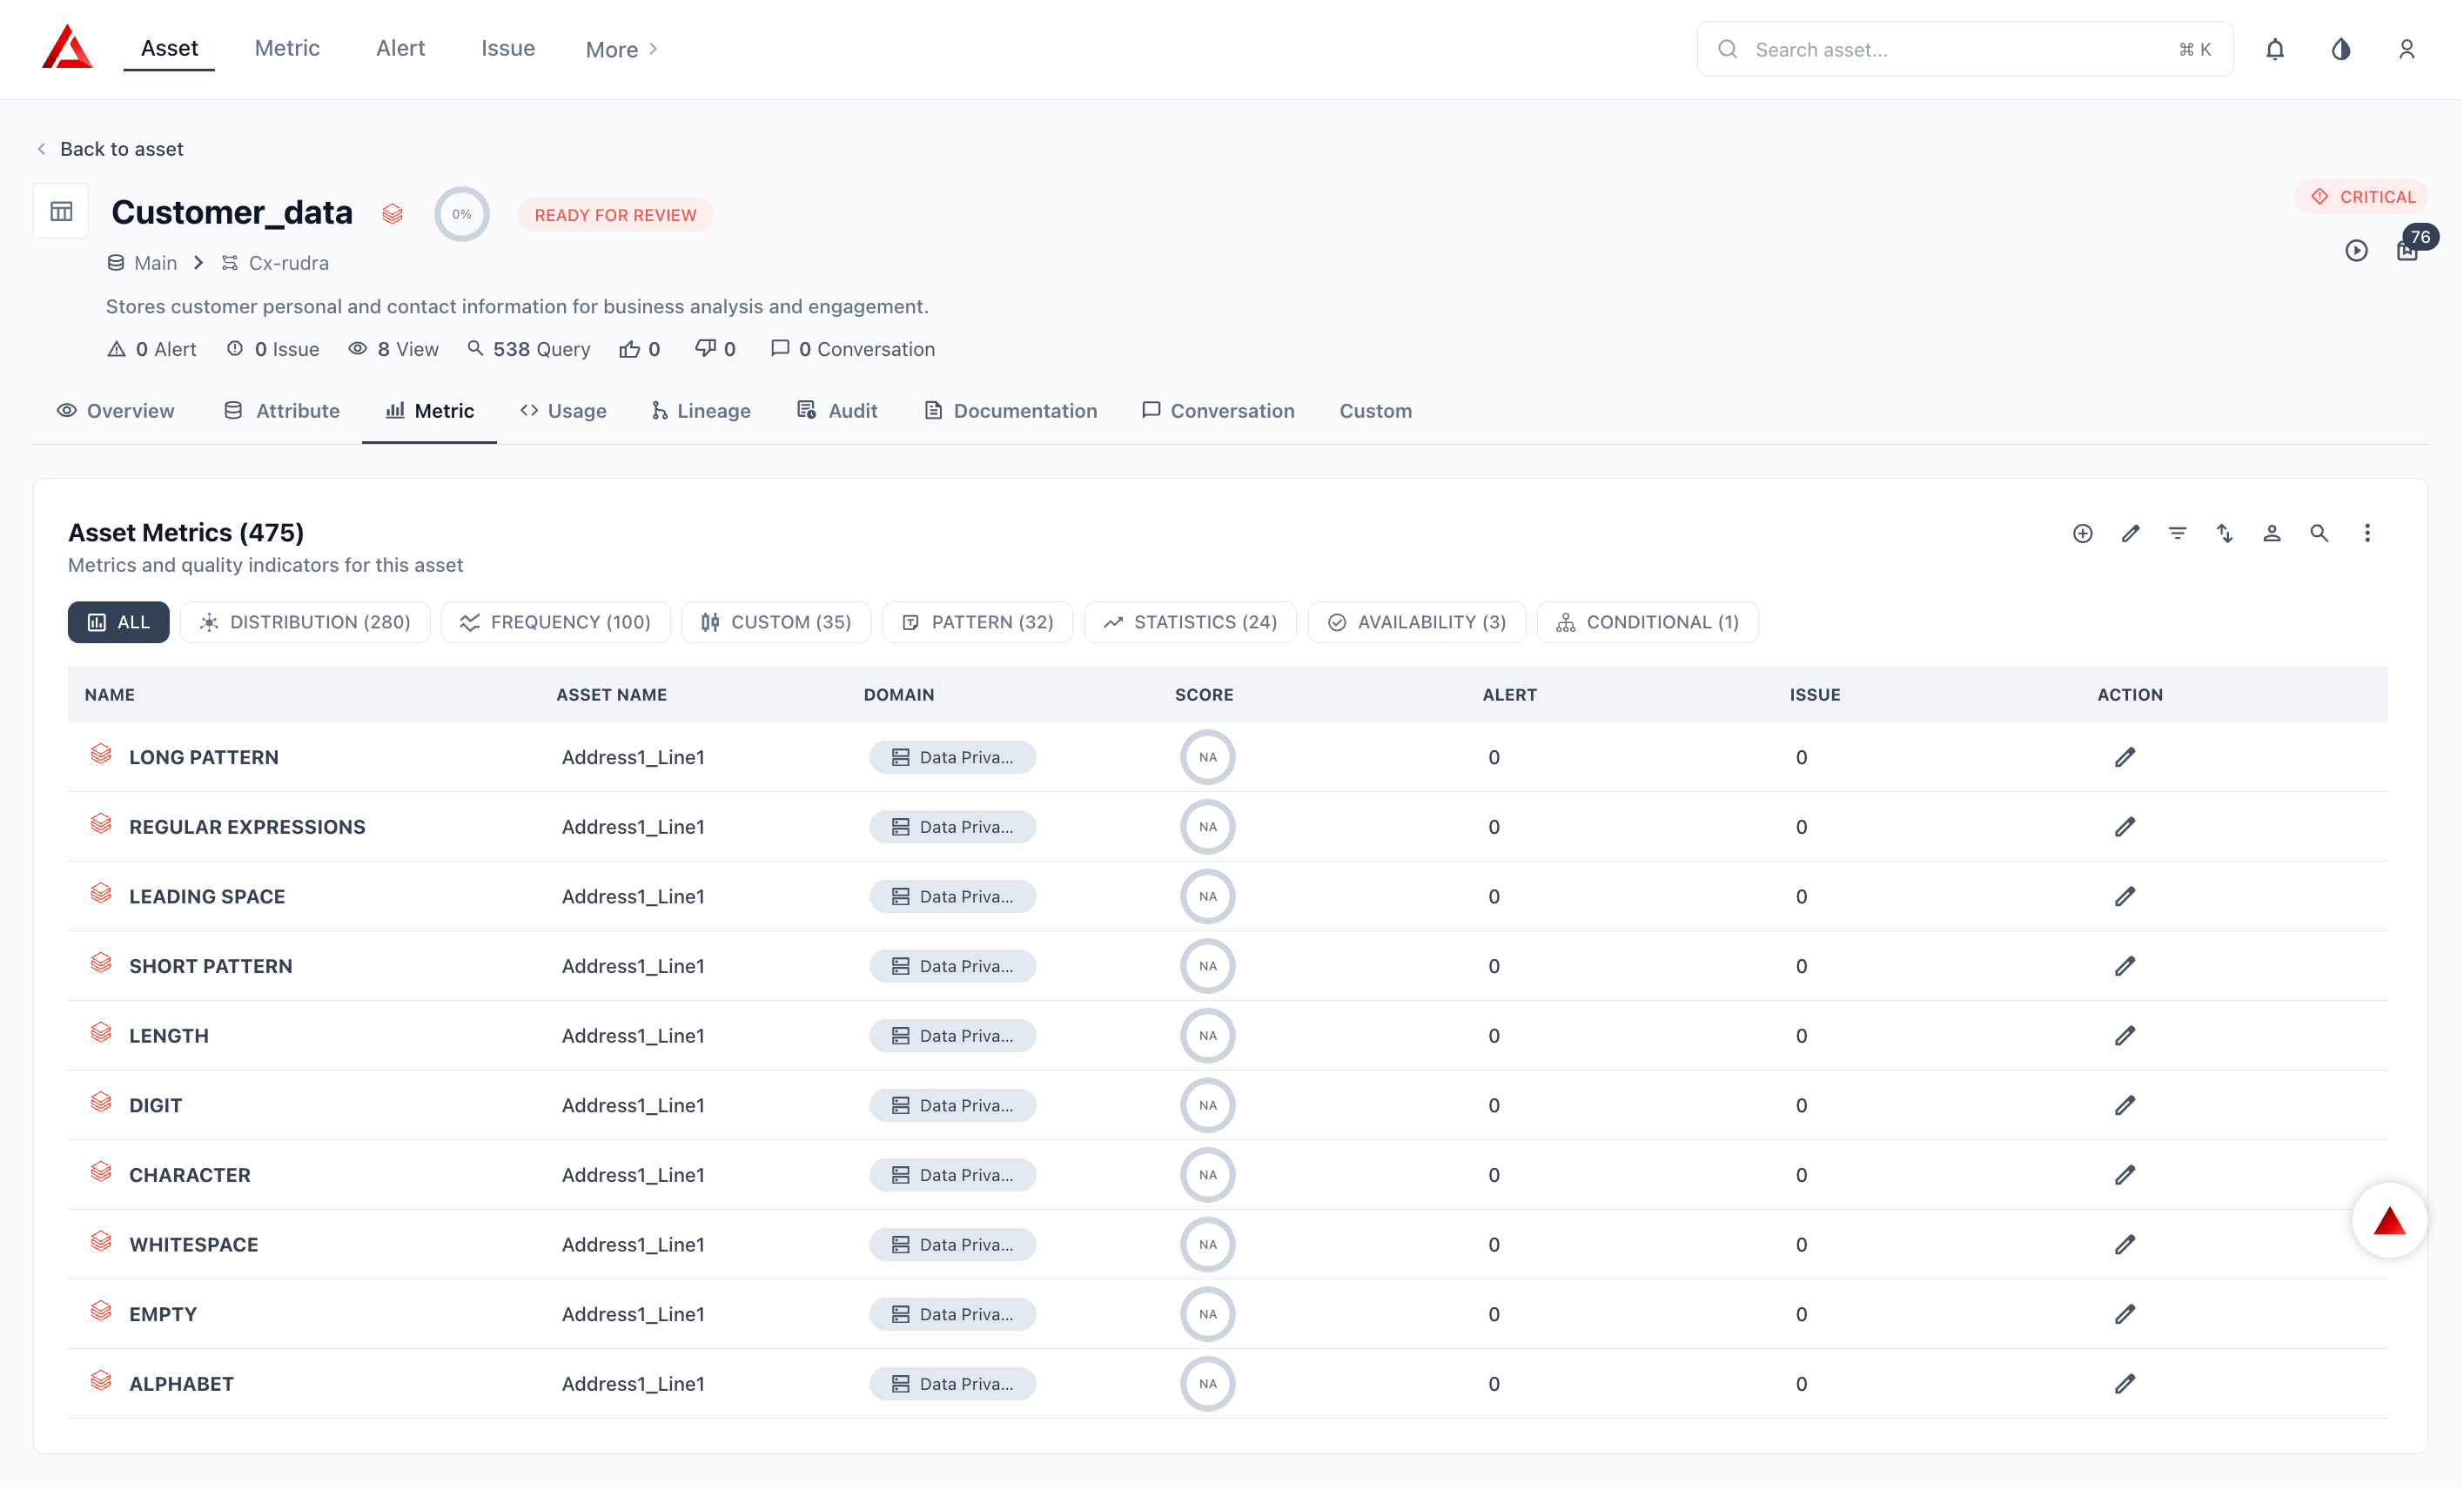 Metrics are filterable by category:
| **Category** | **What It Contains** |
| :--------------- | :---------------------------------------------------------------------------------------------------------------------------------------- |
| **Distribution** | Completeness, uniqueness, character, and space metrics (null count, empty, distinct, repeating, whitespace, leading/trailing space, etc.) |
| **Custom** | User-defined quality rules, filters, and threshold expressions |
| **Frequency** | Value frequency histograms, min/max values, min/max length, value range, and length distribution |
| **Pattern** | Short pattern, long pattern, and user-defined regular expression metrics |
| **Statistics** | Numeric summary metrics: mean, median, mode, standard deviation, sum, Q1, Q3, range, skewness, kurtosis, variance, margin of error |
| **Availability** | Data availability and freshness signals |
| **Conditional** | Metrics applying different logic or thresholds based on a column condition |
The Usage tab surfaces query history for the asset — who queried it, when, and at what cost. It has two sub-views: **Queries** and **Users**. Powered by the PERFORMANCE job (`system.query.history`).
Metrics are filterable by category:
| **Category** | **What It Contains** |
| :--------------- | :---------------------------------------------------------------------------------------------------------------------------------------- |
| **Distribution** | Completeness, uniqueness, character, and space metrics (null count, empty, distinct, repeating, whitespace, leading/trailing space, etc.) |
| **Custom** | User-defined quality rules, filters, and threshold expressions |
| **Frequency** | Value frequency histograms, min/max values, min/max length, value range, and length distribution |
| **Pattern** | Short pattern, long pattern, and user-defined regular expression metrics |
| **Statistics** | Numeric summary metrics: mean, median, mode, standard deviation, sum, Q1, Q3, range, skewness, kurtosis, variance, margin of error |
| **Availability** | Data availability and freshness signals |
| **Conditional** | Metrics applying different logic or thresholds based on a column condition |
The Usage tab surfaces query history for the asset — who queried it, when, and at what cost. It has two sub-views: **Queries** and **Users**. Powered by the PERFORMANCE job (`system.query.history`).
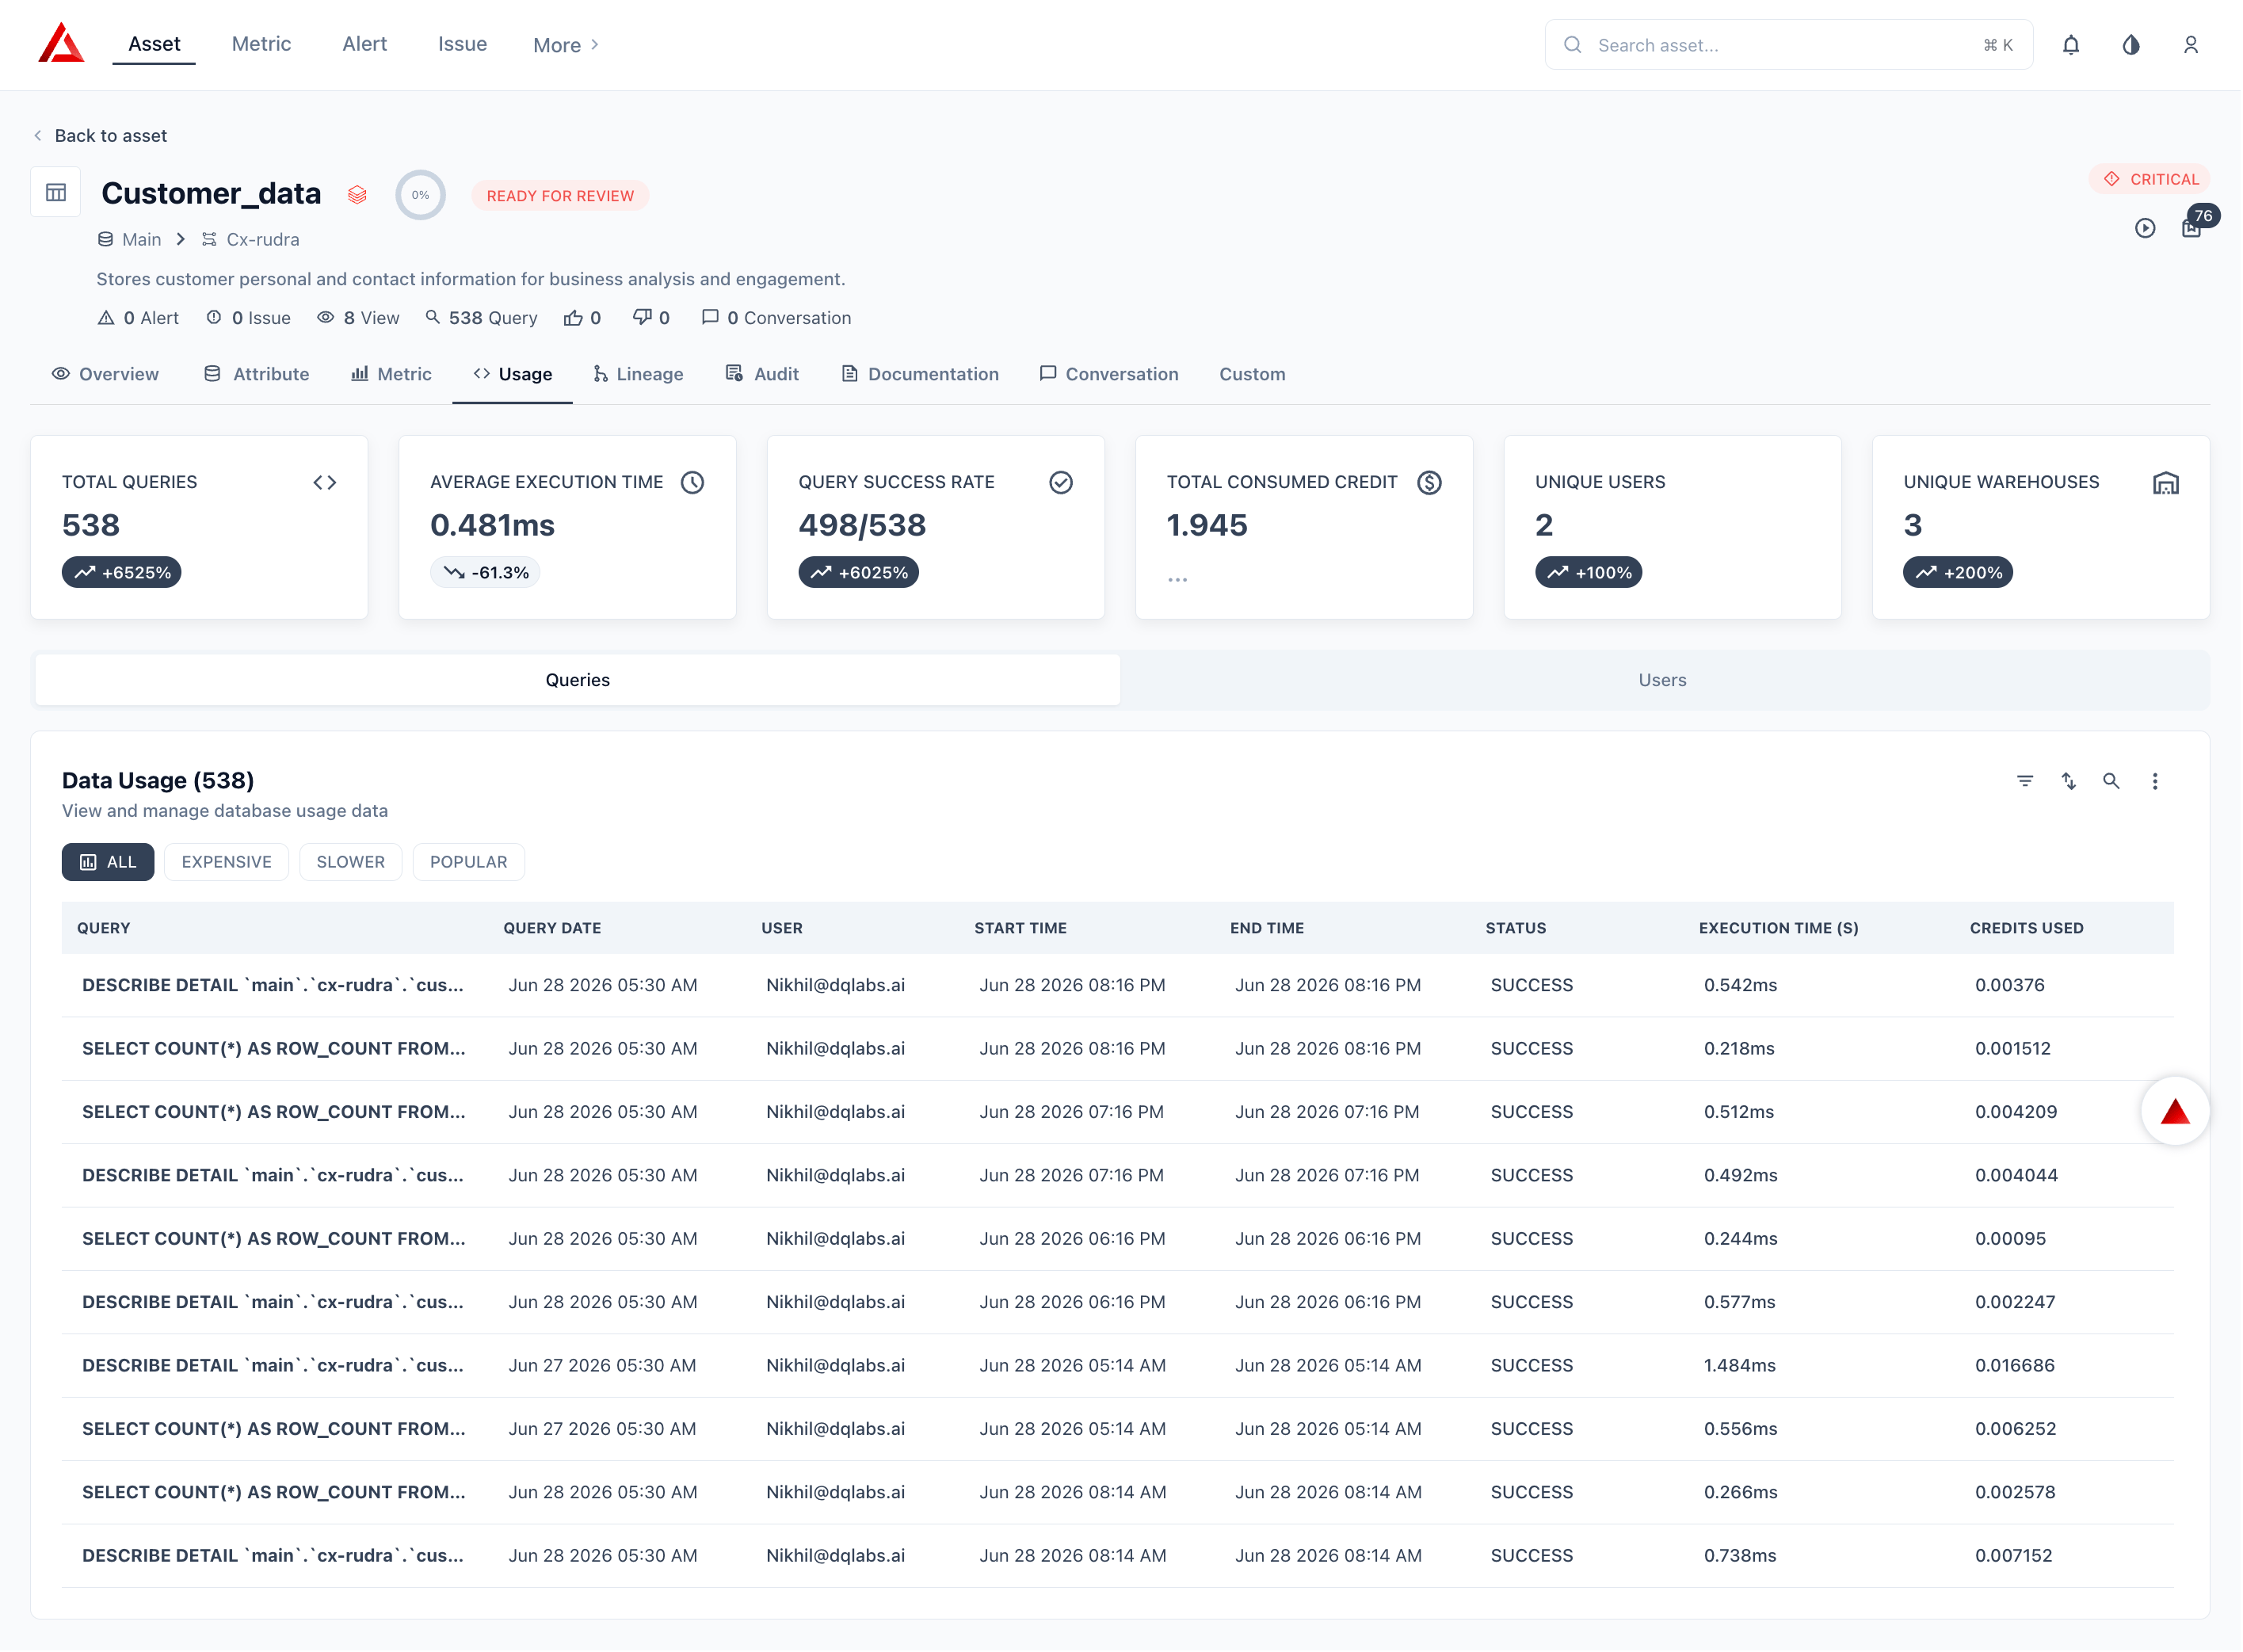 **Queries** — filterable by ALL, EXPENSIVE, SLOWER, POPULAR:
| **Column** | **What Prizm Shows** |
| :--------------------- | :-------------------------------------------- |
| **Query** | The SQL statement executed against this asset |
| **Query Date** | Date the query was run |
| **User** | User or service principal that ran the query |
| **Start Time** | Query start timestamp |
| **End Time** | Query end timestamp |
| **Status** | Query outcome (success, failed, etc.) |
| **Execution Time (s)** | Total execution time in seconds |
| **Credits Used** | Compute credits consumed by this query |
**Users** — shows distinct users who have queried this asset, their query counts, and execution patterns.
Usage data requires the Performance job to be enabled and the service principal to have `SELECT` on `system.query.history`.
The Lineage tab shows upstream sources and downstream consumers as a directed graph. Each node displays the asset name, object type, row count, and column count.
**Queries** — filterable by ALL, EXPENSIVE, SLOWER, POPULAR:
| **Column** | **What Prizm Shows** |
| :--------------------- | :-------------------------------------------- |
| **Query** | The SQL statement executed against this asset |
| **Query Date** | Date the query was run |
| **User** | User or service principal that ran the query |
| **Start Time** | Query start timestamp |
| **End Time** | Query end timestamp |
| **Status** | Query outcome (success, failed, etc.) |
| **Execution Time (s)** | Total execution time in seconds |
| **Credits Used** | Compute credits consumed by this query |
**Users** — shows distinct users who have queried this asset, their query counts, and execution patterns.
Usage data requires the Performance job to be enabled and the service principal to have `SELECT` on `system.query.history`.
The Lineage tab shows upstream sources and downstream consumers as a directed graph. Each node displays the asset name, object type, row count, and column count.
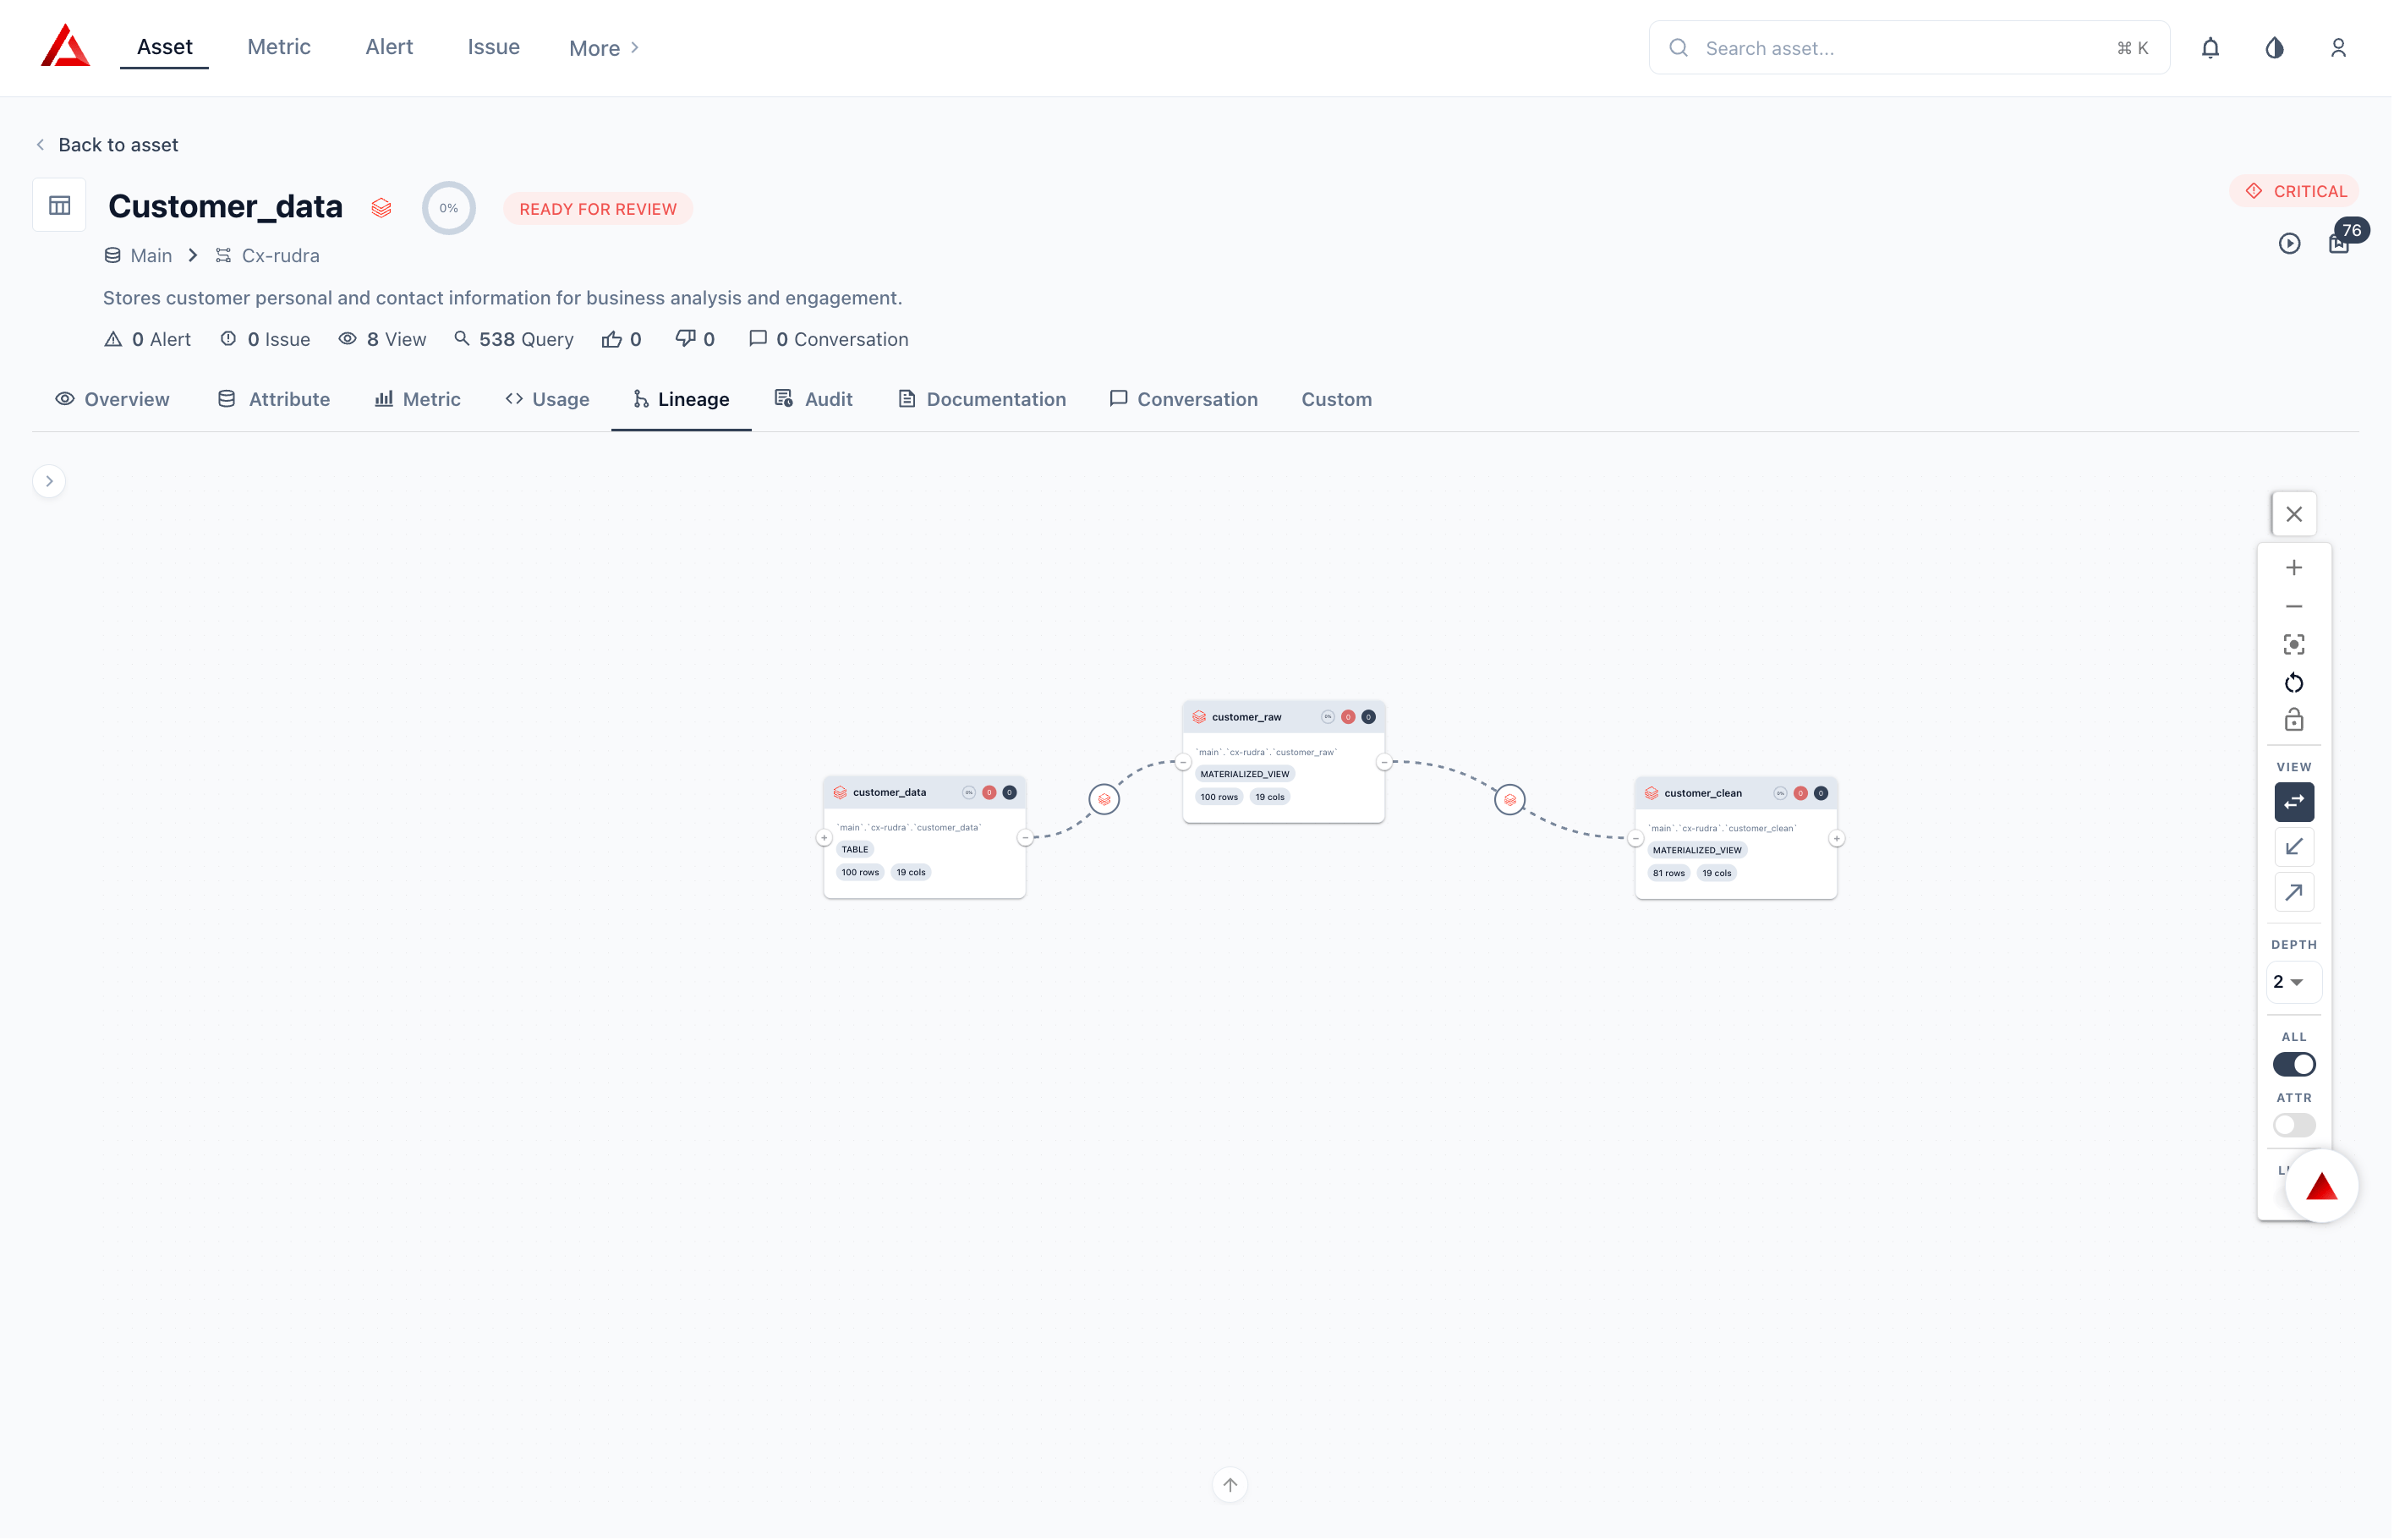 | **Direction** | **What Prizm Shows** |
| :--------------- | :----------------------------------------------------------------- |
| **Upstream** | Tables, views, and external sources this asset reads from |
| **Downstream** | Tables, views, and pipelines that depend on this asset |
| **Column-level** | Which specific columns flow between upstream and downstream assets |
Lineage is extracted from `system.access.table_lineage` (table-level) and `system.access.column_lineage` (column-level) and is triggered only when a DDL change is detected.
The Audit tab is a tamper-evident log of every action taken on the asset — who changed what, and when. It provides a complete change history for governance, compliance, and incident investigation.
| **Direction** | **What Prizm Shows** |
| :--------------- | :----------------------------------------------------------------- |
| **Upstream** | Tables, views, and external sources this asset reads from |
| **Downstream** | Tables, views, and pipelines that depend on this asset |
| **Column-level** | Which specific columns flow between upstream and downstream assets |
Lineage is extracted from `system.access.table_lineage` (table-level) and `system.access.column_lineage` (column-level) and is triggered only when a DDL change is detected.
The Audit tab is a tamper-evident log of every action taken on the asset — who changed what, and when. It provides a complete change history for governance, compliance, and incident investigation.
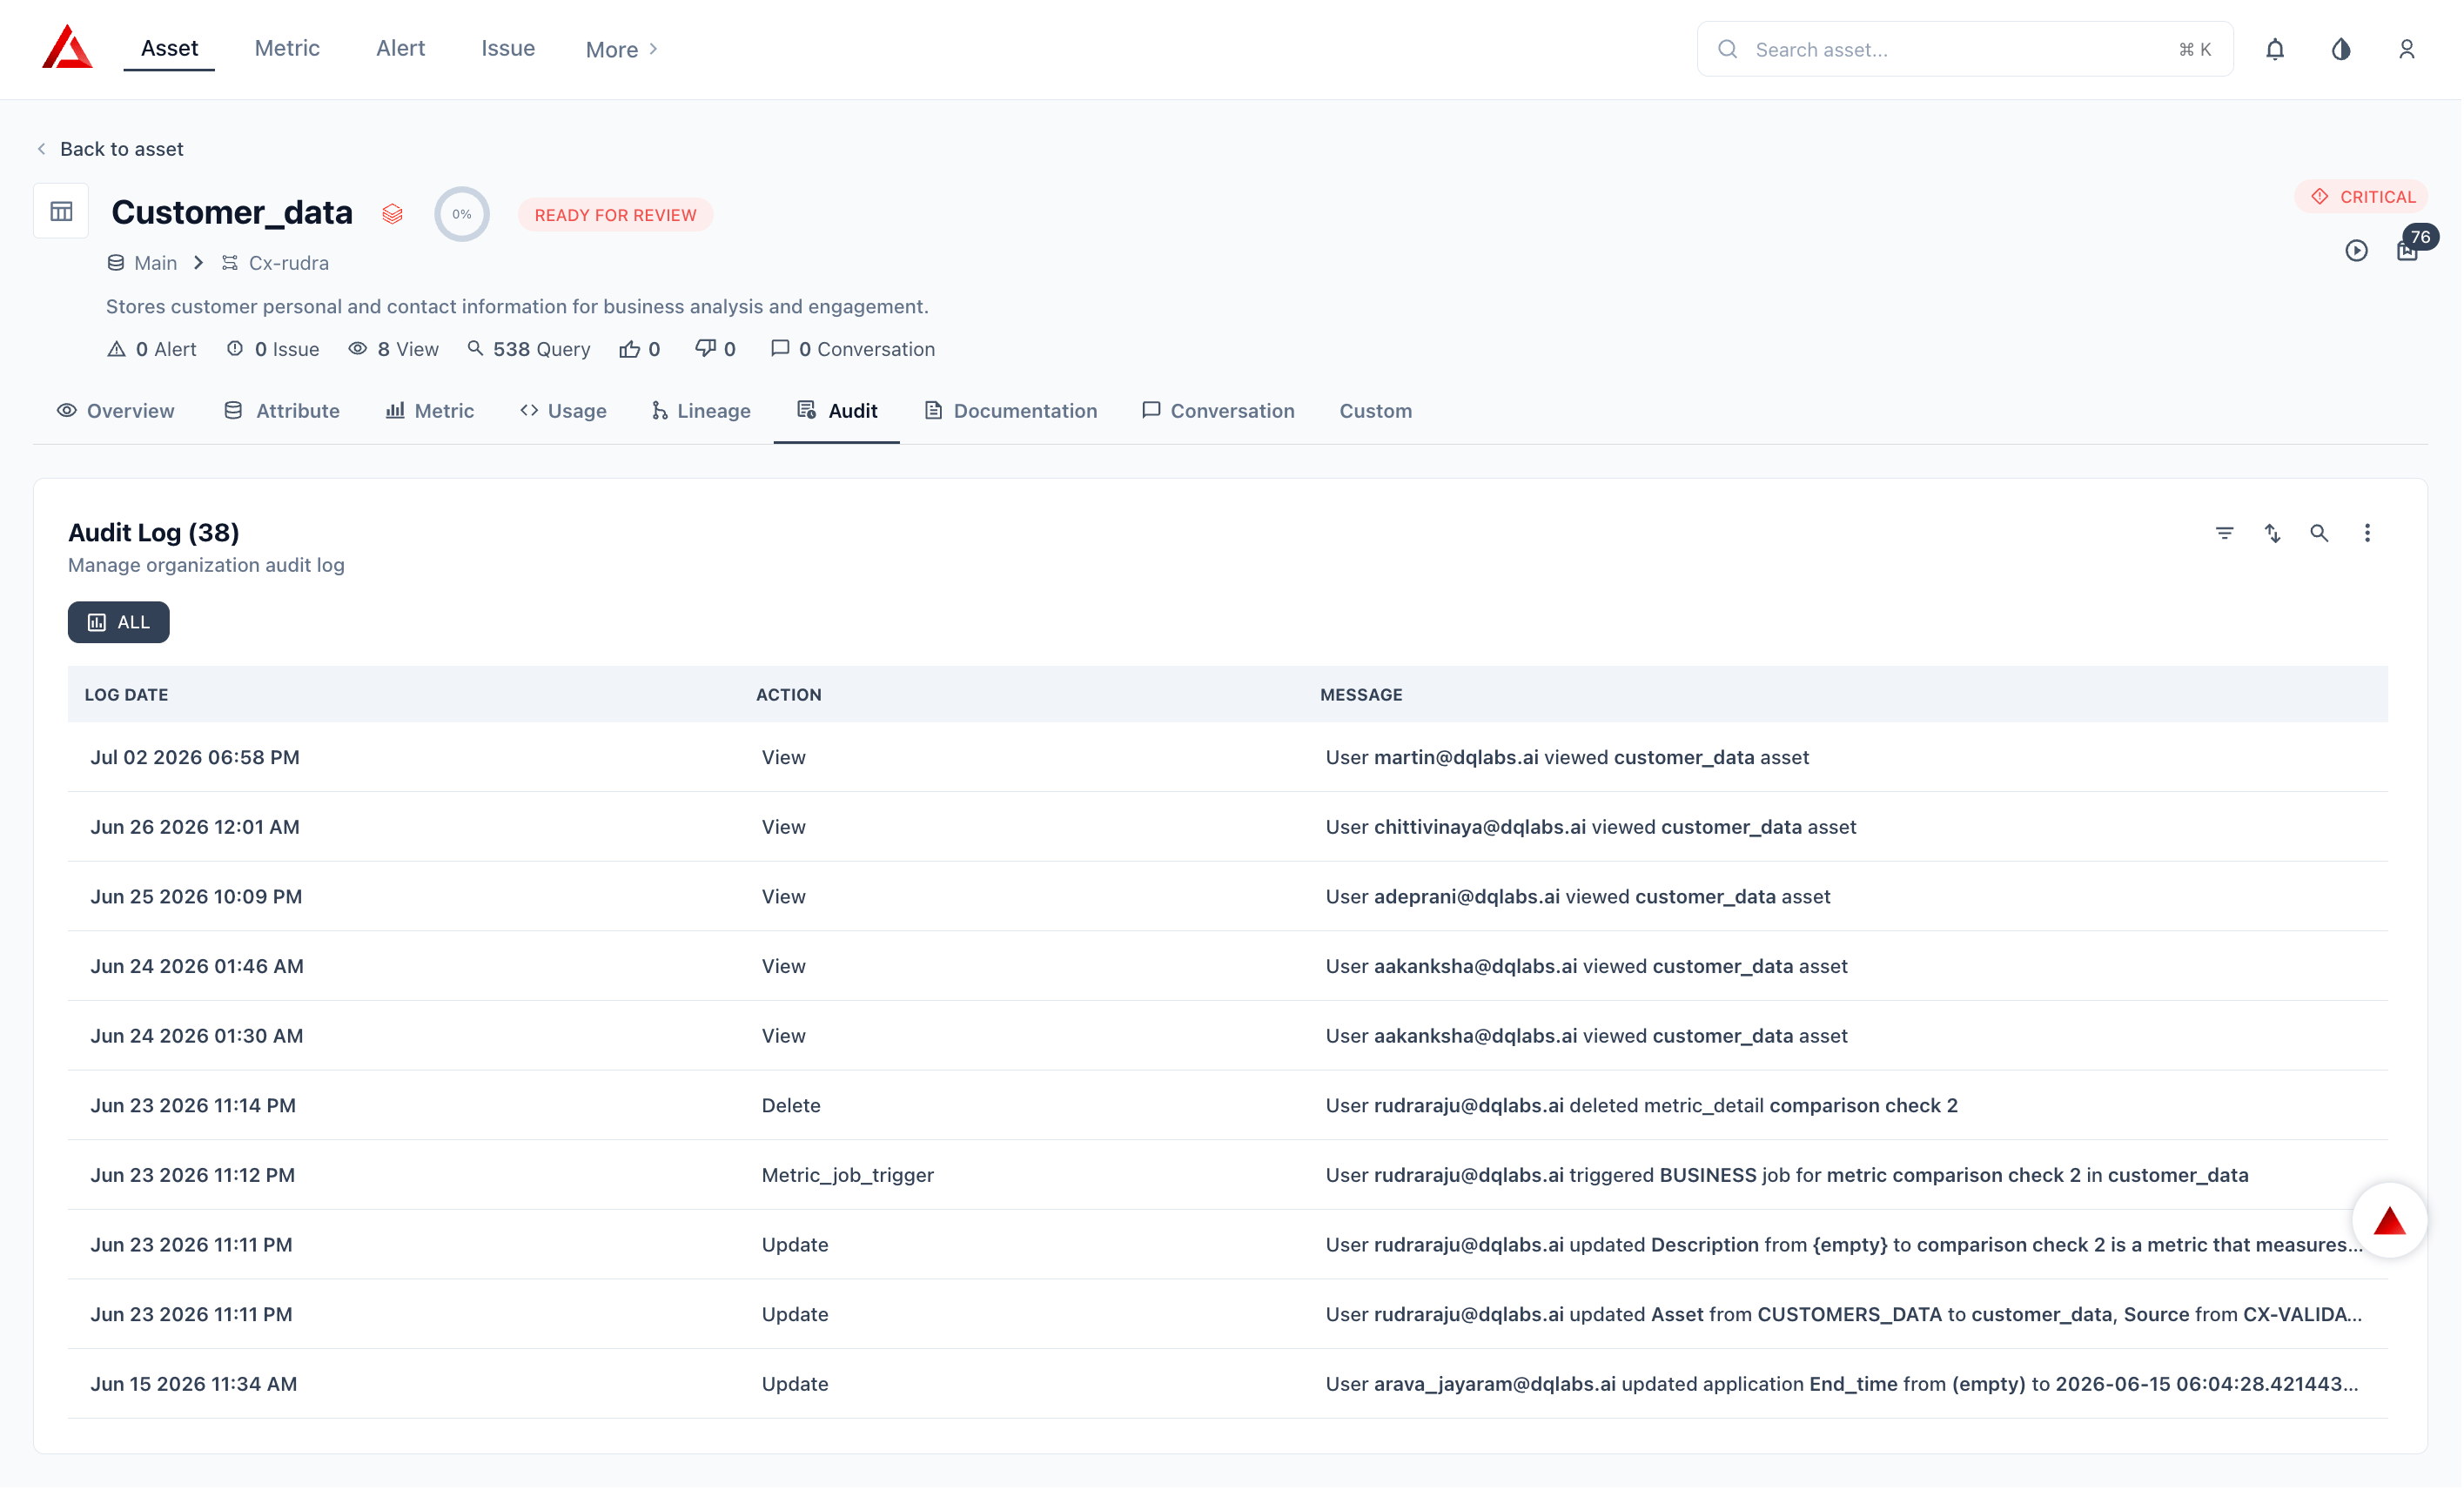 | **Column** | **What Prizm Shows** |
| :----------- | :------------------------------------------------------------------------------------ |
| **Log Date** | Timestamp of the recorded action |
| **Action** | Type of change (e.g., metadata update, description edit, owner change, status update) |
| **Message** | Human-readable detail of what changed and by whom |
The log is filterable by action type. All records are immutable — entries cannot be edited or deleted from the UI.
## Pipeline Asset Pages
When **Enable pipelines and jobs** is turned on, each Databricks Job, Workflow, and Delta Live Table gets its own pipeline asset page in Prizm. The pipeline asset page has a different tab set from table and view assets, reflecting the operational and run-level nature of pipeline observability.
| **Column** | **What Prizm Shows** |
| :----------- | :------------------------------------------------------------------------------------ |
| **Log Date** | Timestamp of the recorded action |
| **Action** | Type of change (e.g., metadata update, description edit, owner change, status update) |
| **Message** | Human-readable detail of what changed and by whom |
The log is filterable by action type. All records are immutable — entries cannot be edited or deleted from the UI.
## Pipeline Asset Pages
When **Enable pipelines and jobs** is turned on, each Databricks Job, Workflow, and Delta Live Table gets its own pipeline asset page in Prizm. The pipeline asset page has a different tab set from table and view assets, reflecting the operational and run-level nature of pipeline observability.
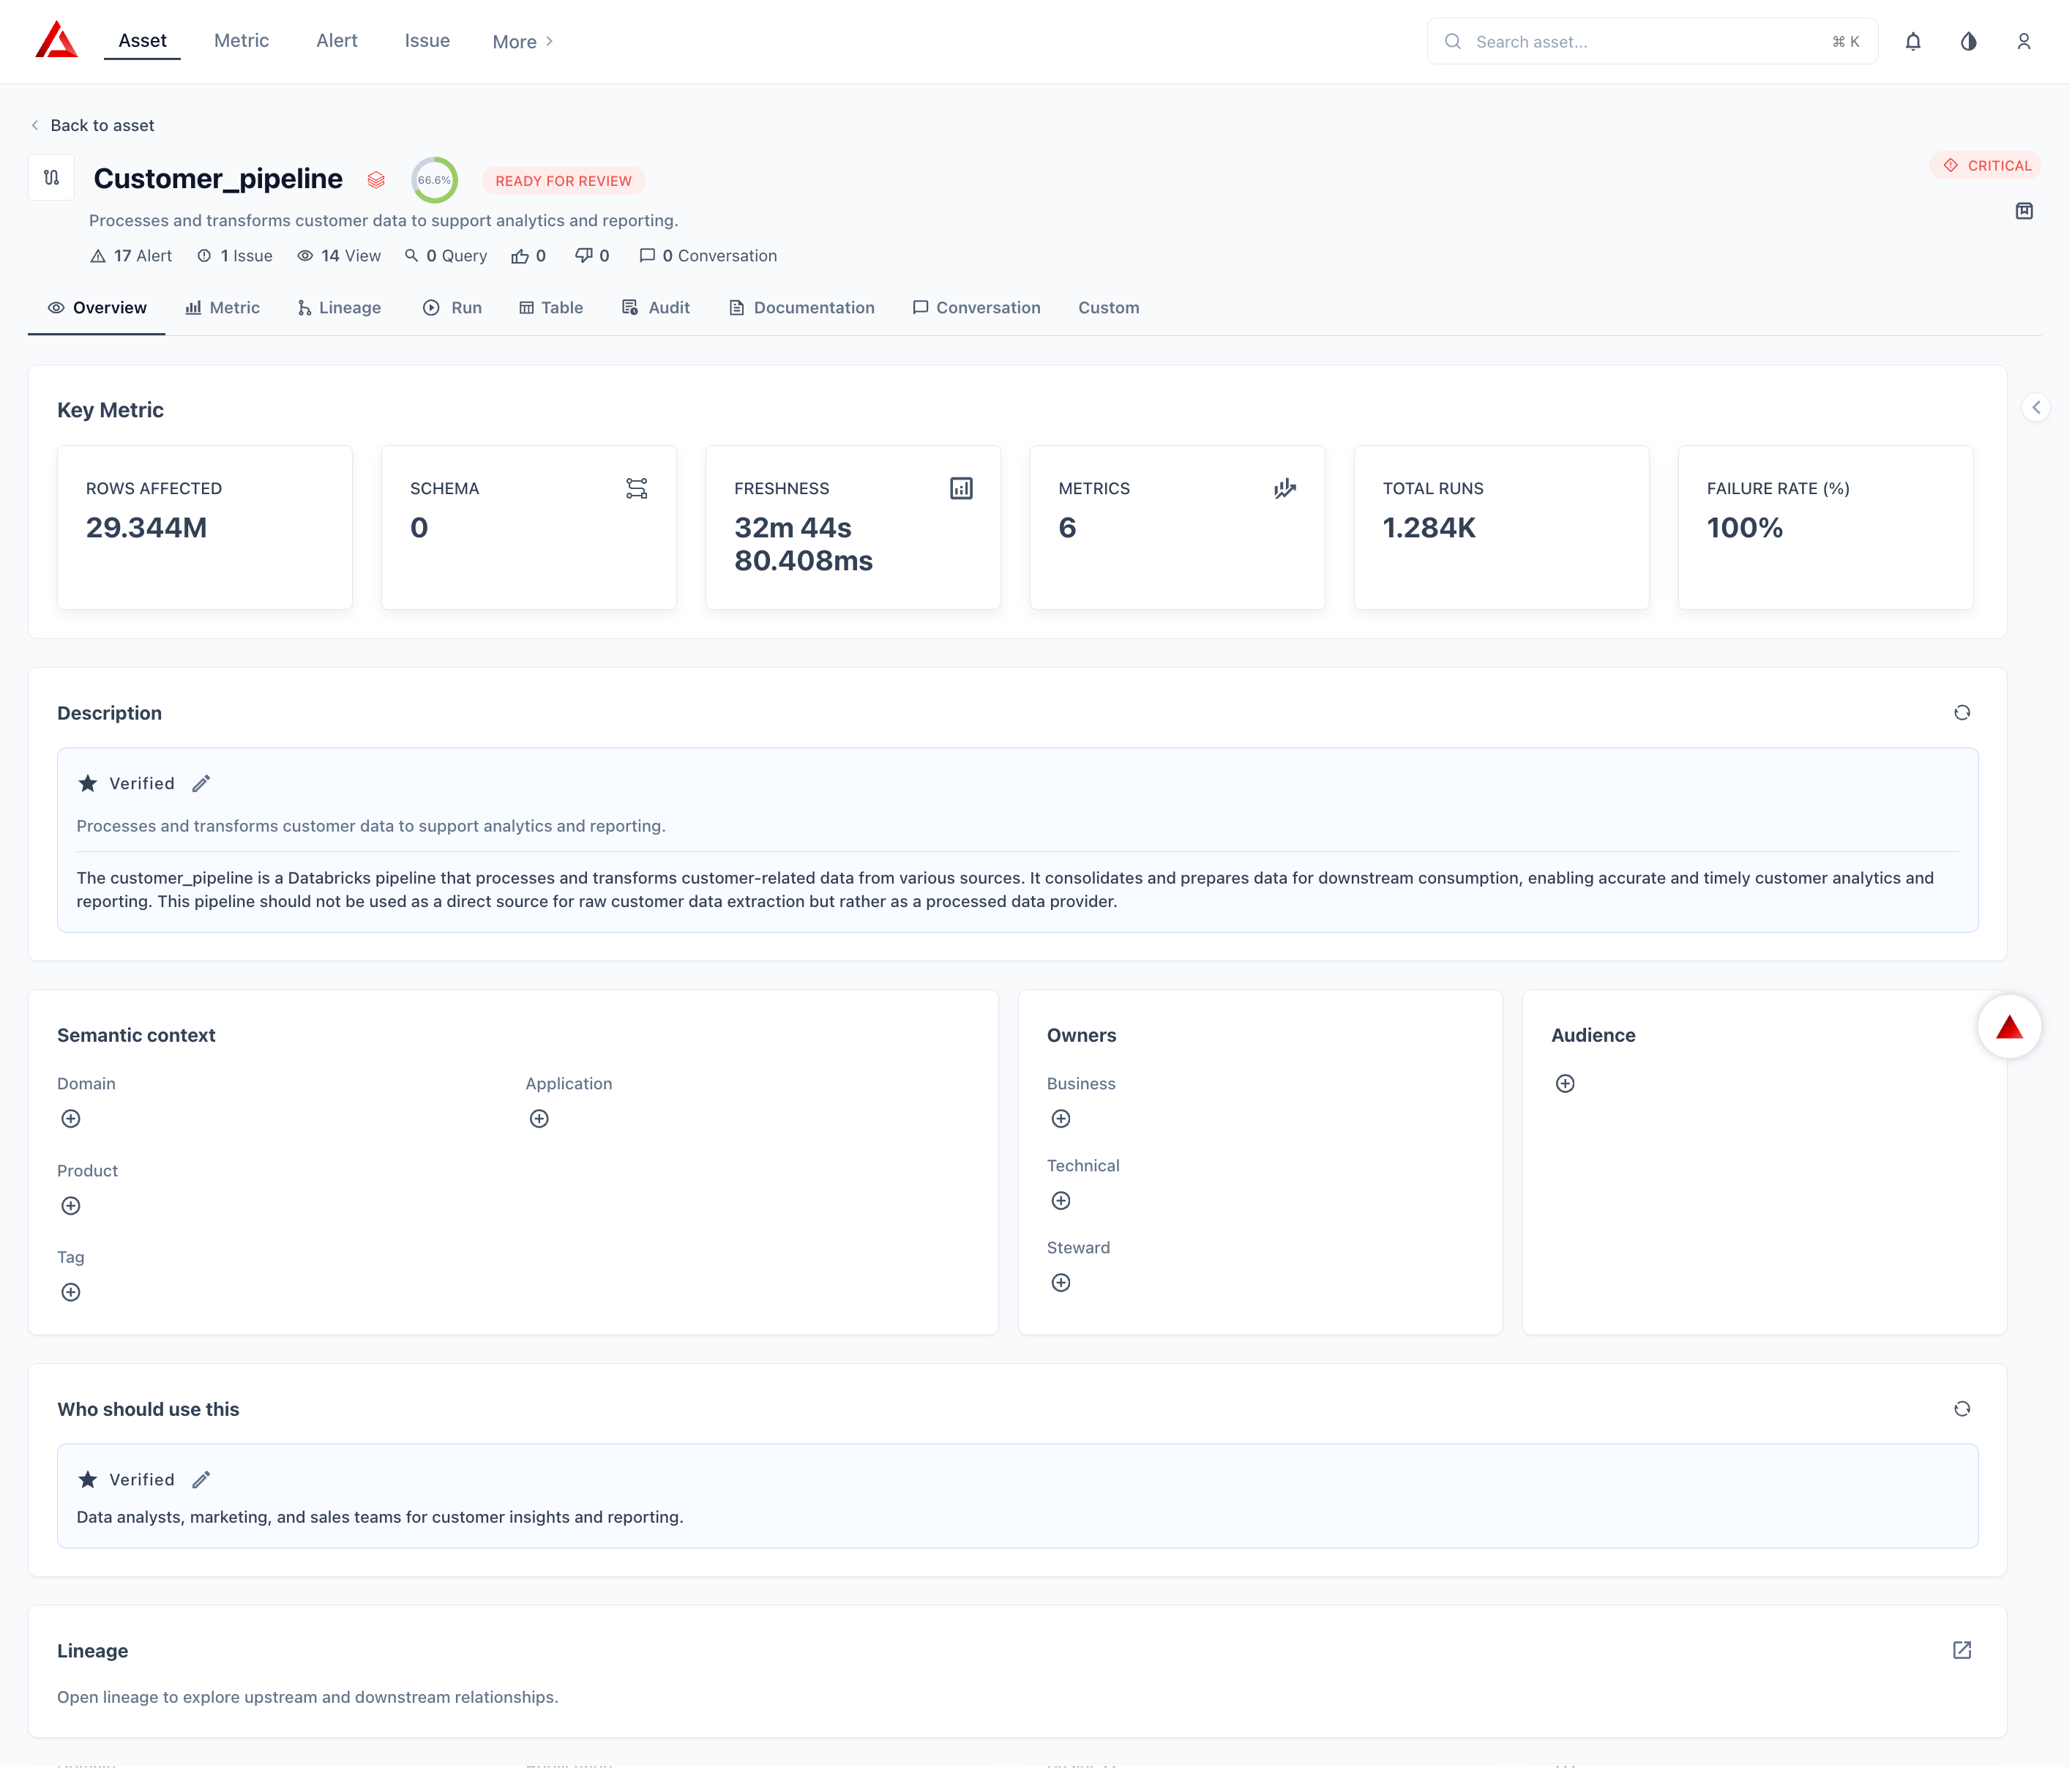 | **Section** | **What Prizm Shows** |
| :------------------- | :------------------------------------------------------------------------------------------------------------------------------------------------------------------------------------------------------------------------------ |
| **Quality Score** | Overall quality percentage across all active pipeline metrics |
| **Status** | Review state and criticality badge |
| **Key Metrics** | ROWS AFFECTED (rows written per run), SCHEMA (output schema column count), FRESHNESS (time since last successful run), METRICS (active metric count), TOTAL RUNS (total historical runs), FAILURE RATE % (rolling failure rate) |
| **Description** | AI-generated or manually verified description of the pipeline |
| **Semantic Context** | Domain, Application, Product, Tag, and Terms classifications |
| **Owners** | Business owner, Technical owner, and Steward contacts |
The Metric tab lists all quality metrics defined on the pipeline asset — including observability metrics such as Execution Status, Freshness, Failure Rate, Rows Affected, and Dropped Records.
| **Section** | **What Prizm Shows** |
| :------------------- | :------------------------------------------------------------------------------------------------------------------------------------------------------------------------------------------------------------------------------ |
| **Quality Score** | Overall quality percentage across all active pipeline metrics |
| **Status** | Review state and criticality badge |
| **Key Metrics** | ROWS AFFECTED (rows written per run), SCHEMA (output schema column count), FRESHNESS (time since last successful run), METRICS (active metric count), TOTAL RUNS (total historical runs), FAILURE RATE % (rolling failure rate) |
| **Description** | AI-generated or manually verified description of the pipeline |
| **Semantic Context** | Domain, Application, Product, Tag, and Terms classifications |
| **Owners** | Business owner, Technical owner, and Steward contacts |
The Metric tab lists all quality metrics defined on the pipeline asset — including observability metrics such as Execution Status, Freshness, Failure Rate, Rows Affected, and Dropped Records.
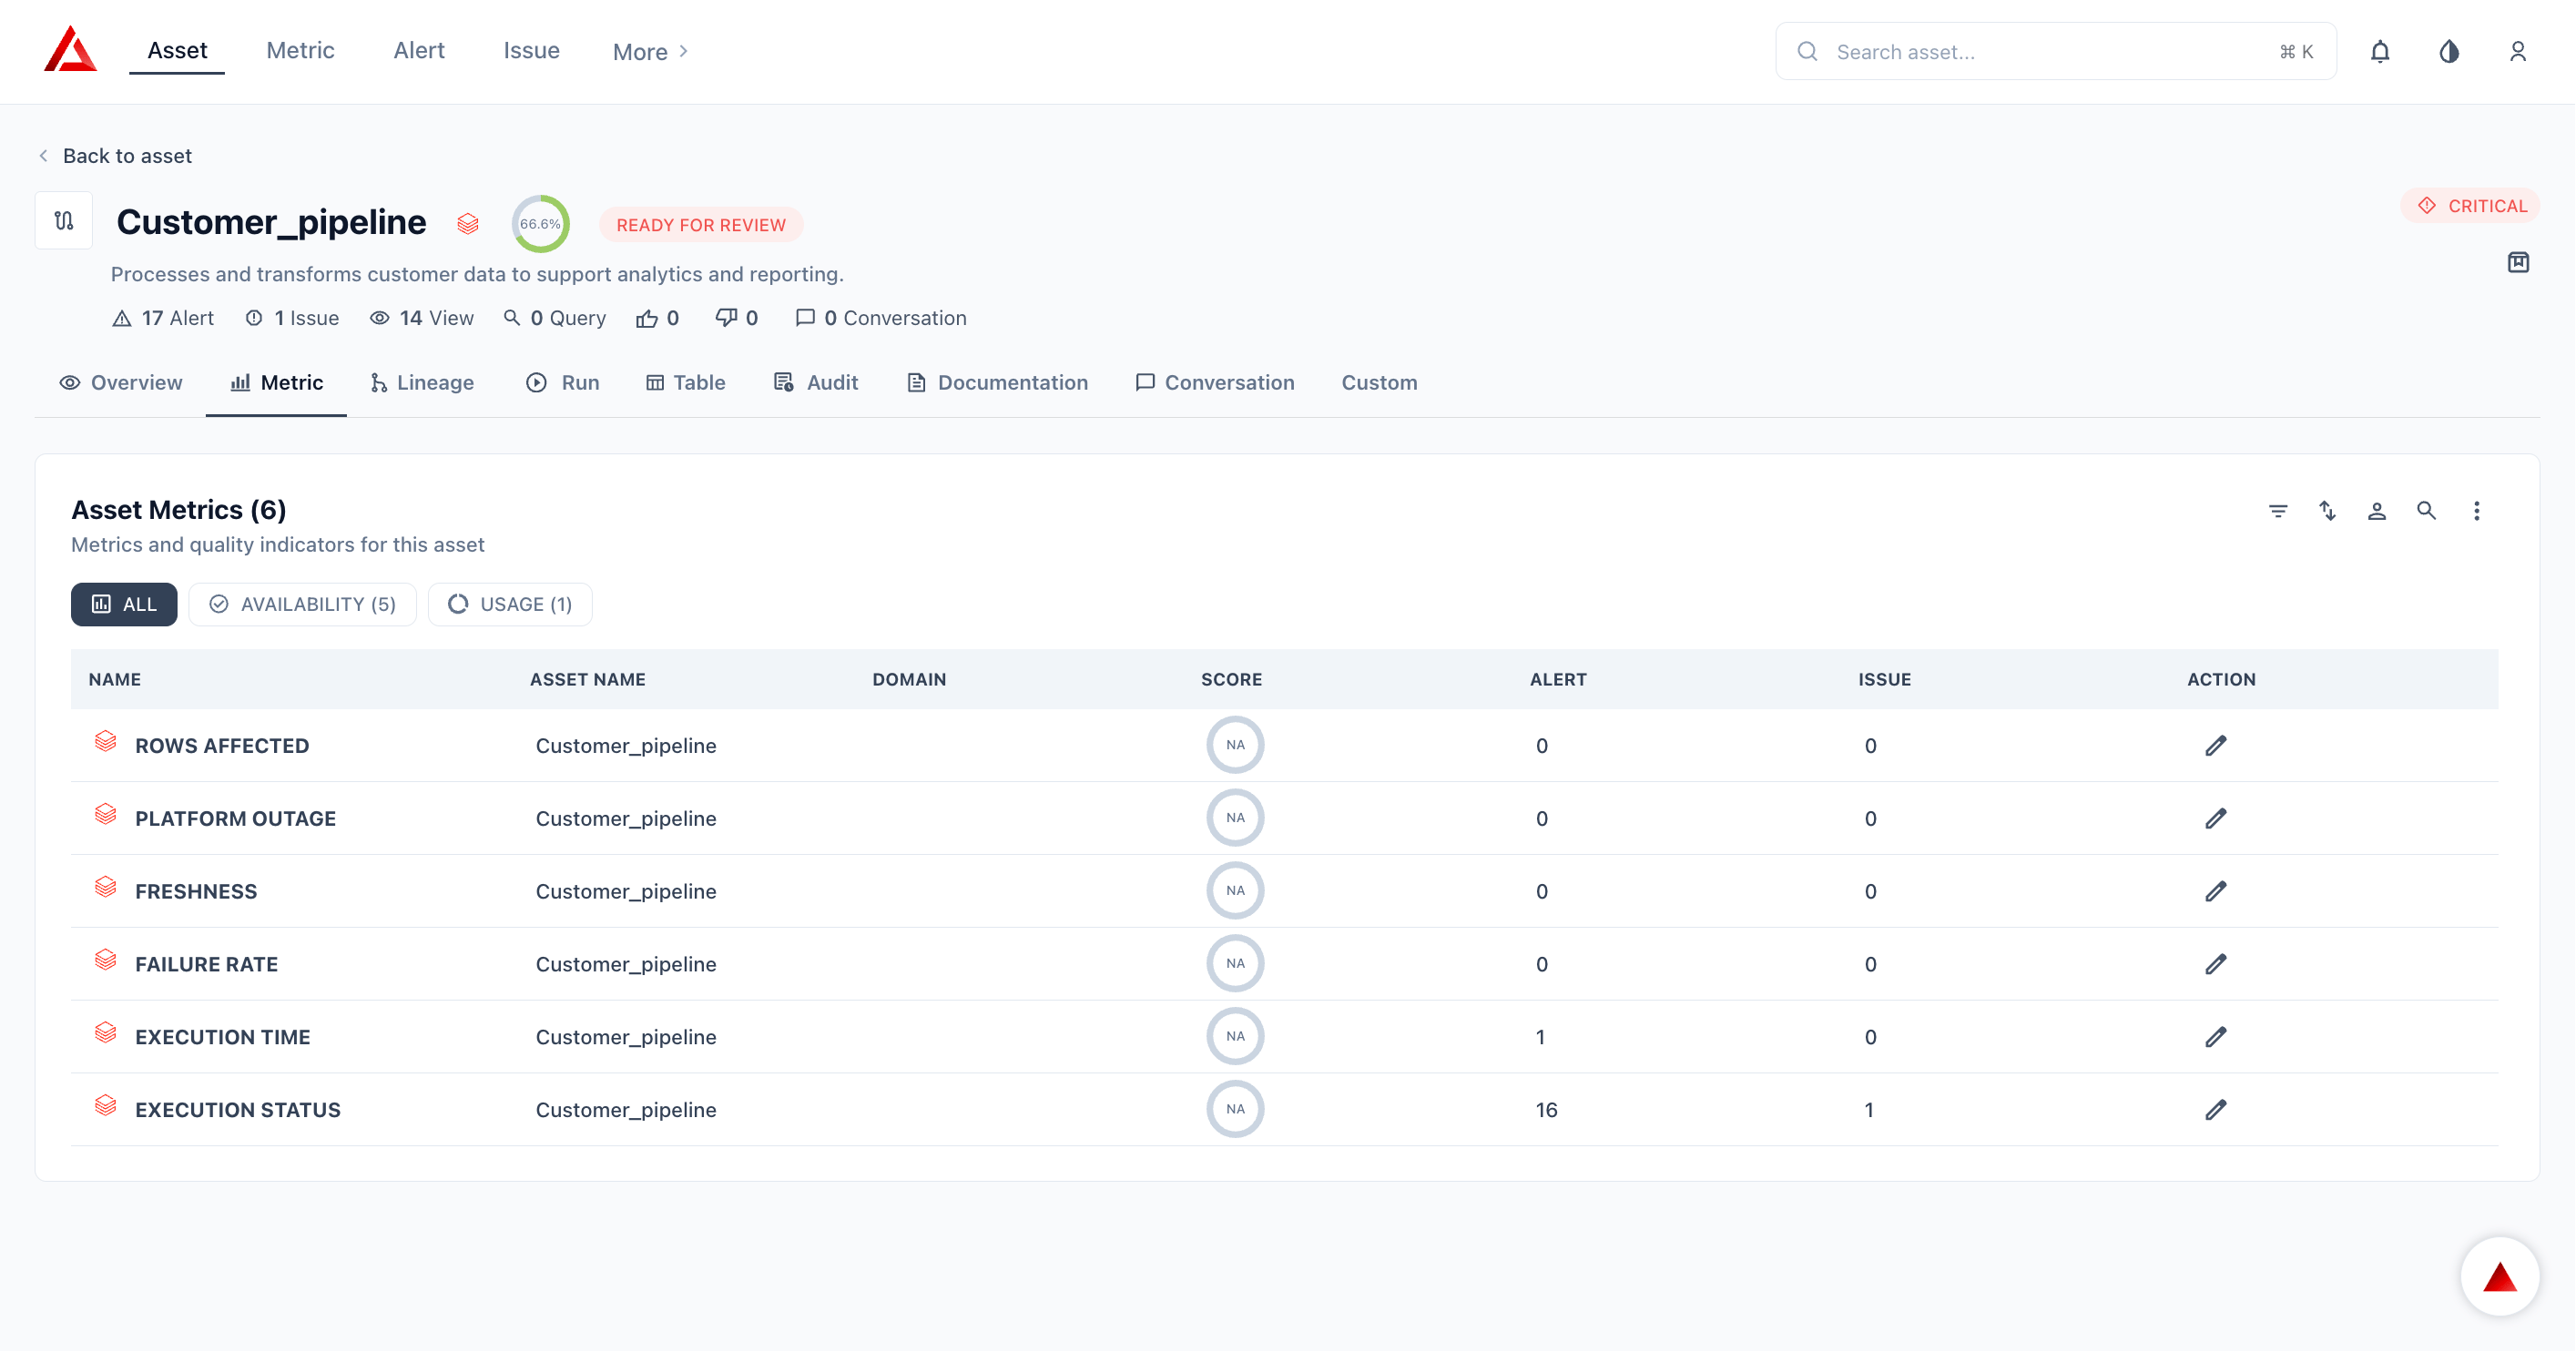 | **Metric** | **What It Measures** |
| :------------------- | :----------------------------------------------------------------------- |
| **Execution Status** | Whether the most recent pipeline run succeeded, failed, or was cancelled |
| **Freshness** | Time elapsed since the last successful pipeline completion |
| **Rows Affected** | Number of rows written, updated, or deleted by the pipeline run |
| **Failure Rate** | Percentage of pipeline runs that have failed over a rolling window |
| **Dropped Records** | Records discarded due to DLT `EXPECT` constraint violations |
| **Failed Records** | Records that failed validation or processing rules |
The Lineage tab renders a directed graph showing the upstream source tables the pipeline reads from and the downstream tables it produces.
| **Metric** | **What It Measures** |
| :------------------- | :----------------------------------------------------------------------- |
| **Execution Status** | Whether the most recent pipeline run succeeded, failed, or was cancelled |
| **Freshness** | Time elapsed since the last successful pipeline completion |
| **Rows Affected** | Number of rows written, updated, or deleted by the pipeline run |
| **Failure Rate** | Percentage of pipeline runs that have failed over a rolling window |
| **Dropped Records** | Records discarded due to DLT `EXPECT` constraint violations |
| **Failed Records** | Records that failed validation or processing rules |
The Lineage tab renders a directed graph showing the upstream source tables the pipeline reads from and the downstream tables it produces.
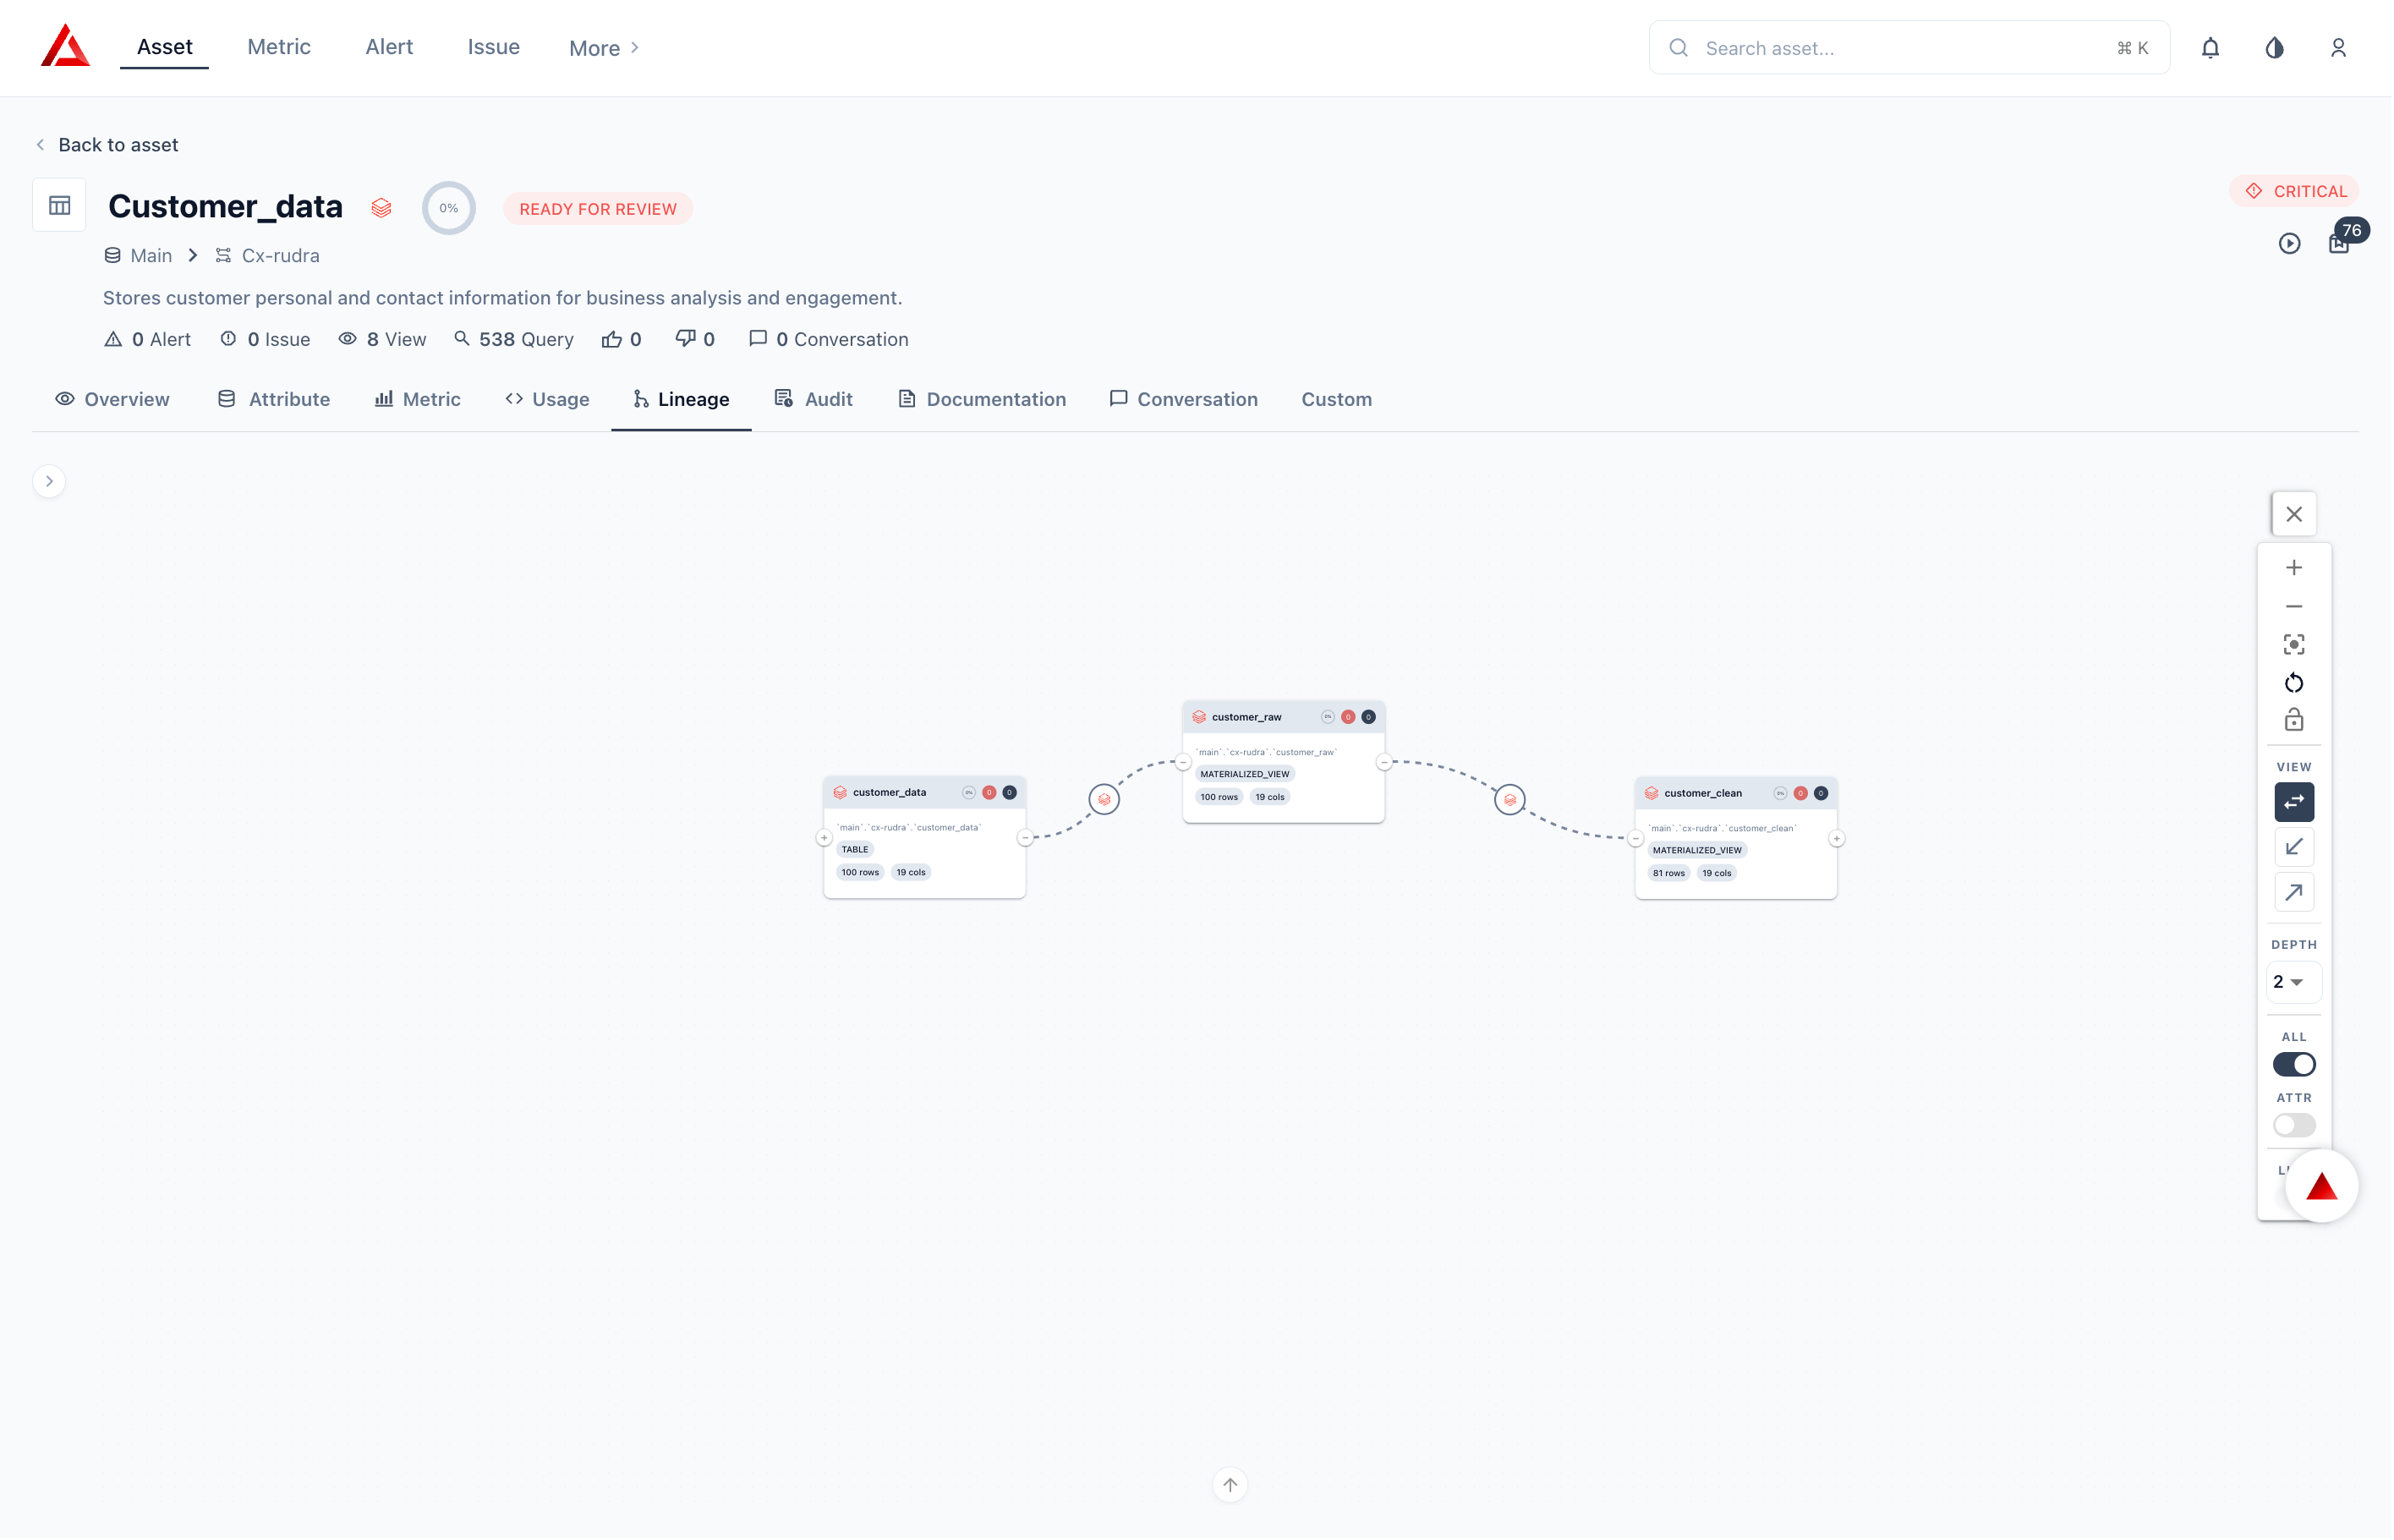 | **Direction** | **What Prizm Shows** |
| :------------- | :------------------------------------------------ |
| **Upstream** | Source tables and views the pipeline reads from |
| **Downstream** | Output tables and assets produced by the pipeline |
Lineage for pipeline assets is extracted from the DLT `flow_definition` event log and the Databricks Jobs REST API.
The Run tab shows the full execution history for the pipeline — every run Prizm has ingested within the lookback window, with status, duration, trigger, and environment context.
| **Direction** | **What Prizm Shows** |
| :------------- | :------------------------------------------------ |
| **Upstream** | Source tables and views the pipeline reads from |
| **Downstream** | Output tables and assets produced by the pipeline |
Lineage for pipeline assets is extracted from the DLT `flow_definition` event log and the Databricks Jobs REST API.
The Run tab shows the full execution history for the pipeline — every run Prizm has ingested within the lookback window, with status, duration, trigger, and environment context.
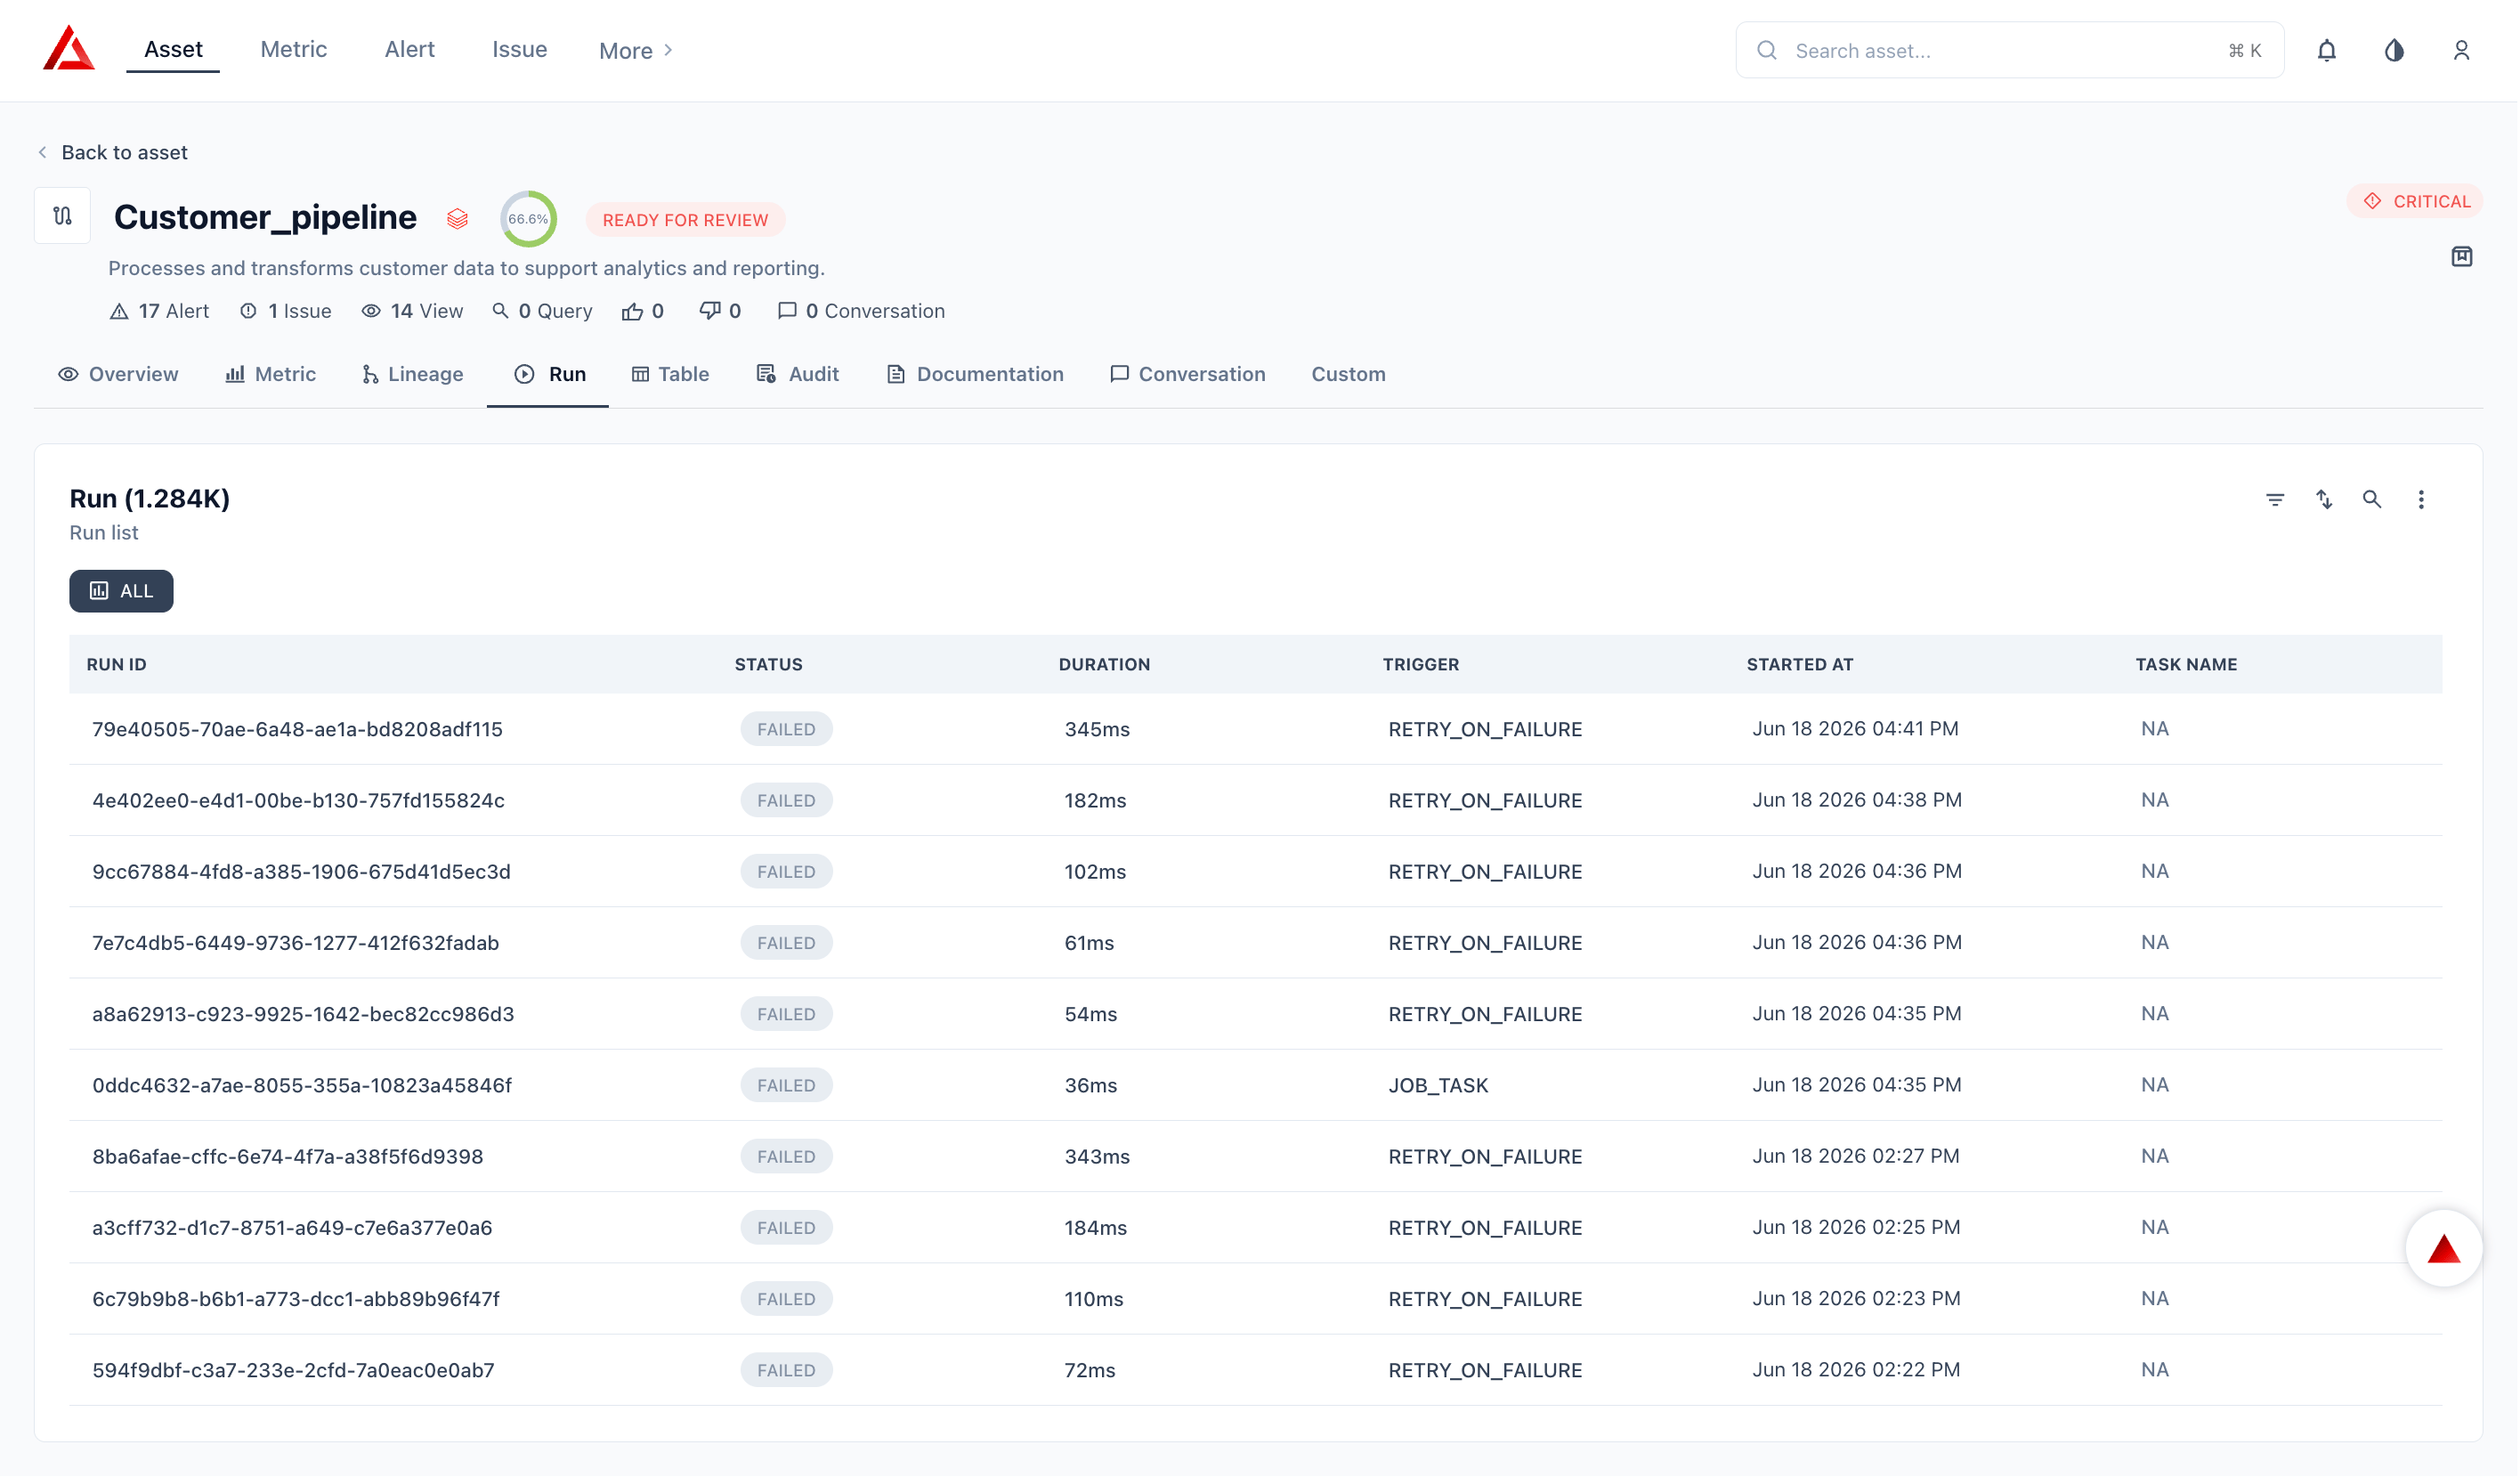 | **Column** | **What Prizm Shows** |
| :-------------- | :------------------------------------------------------------------------------ |
| **Run ID** | Unique identifier for this pipeline execution |
| **Status** | Run outcome: SUCCESS, FAILED, CANCELLED, SKIPPED, RUNNING |
| **Error** | Error message or failure reason if the run did not succeed |
| **Duration** | Total elapsed time for the run |
| **Trigger** | What initiated the run — JOB\_TASK, RETRY\_ON\_FAILURE, MANUAL, SCHEDULED, etc. |
| **Environment** | Databricks environment context (workspace, cluster) |
| **Started At** | Run start timestamp |
Runs are filterable by status. Click any run row to expand the detail view showing task-level breakdown and error logs.
The Table tab lists the data source tables that this pipeline reads from or writes to — providing direct traceability between the pipeline and the warehouse assets it touches.
| **Column** | **What Prizm Shows** |
| :-------------- | :------------------------------------------------------------------------------ |
| **Run ID** | Unique identifier for this pipeline execution |
| **Status** | Run outcome: SUCCESS, FAILED, CANCELLED, SKIPPED, RUNNING |
| **Error** | Error message or failure reason if the run did not succeed |
| **Duration** | Total elapsed time for the run |
| **Trigger** | What initiated the run — JOB\_TASK, RETRY\_ON\_FAILURE, MANUAL, SCHEDULED, etc. |
| **Environment** | Databricks environment context (workspace, cluster) |
| **Started At** | Run start timestamp |
Runs are filterable by status. Click any run row to expand the detail view showing task-level breakdown and error logs.
The Table tab lists the data source tables that this pipeline reads from or writes to — providing direct traceability between the pipeline and the warehouse assets it touches.
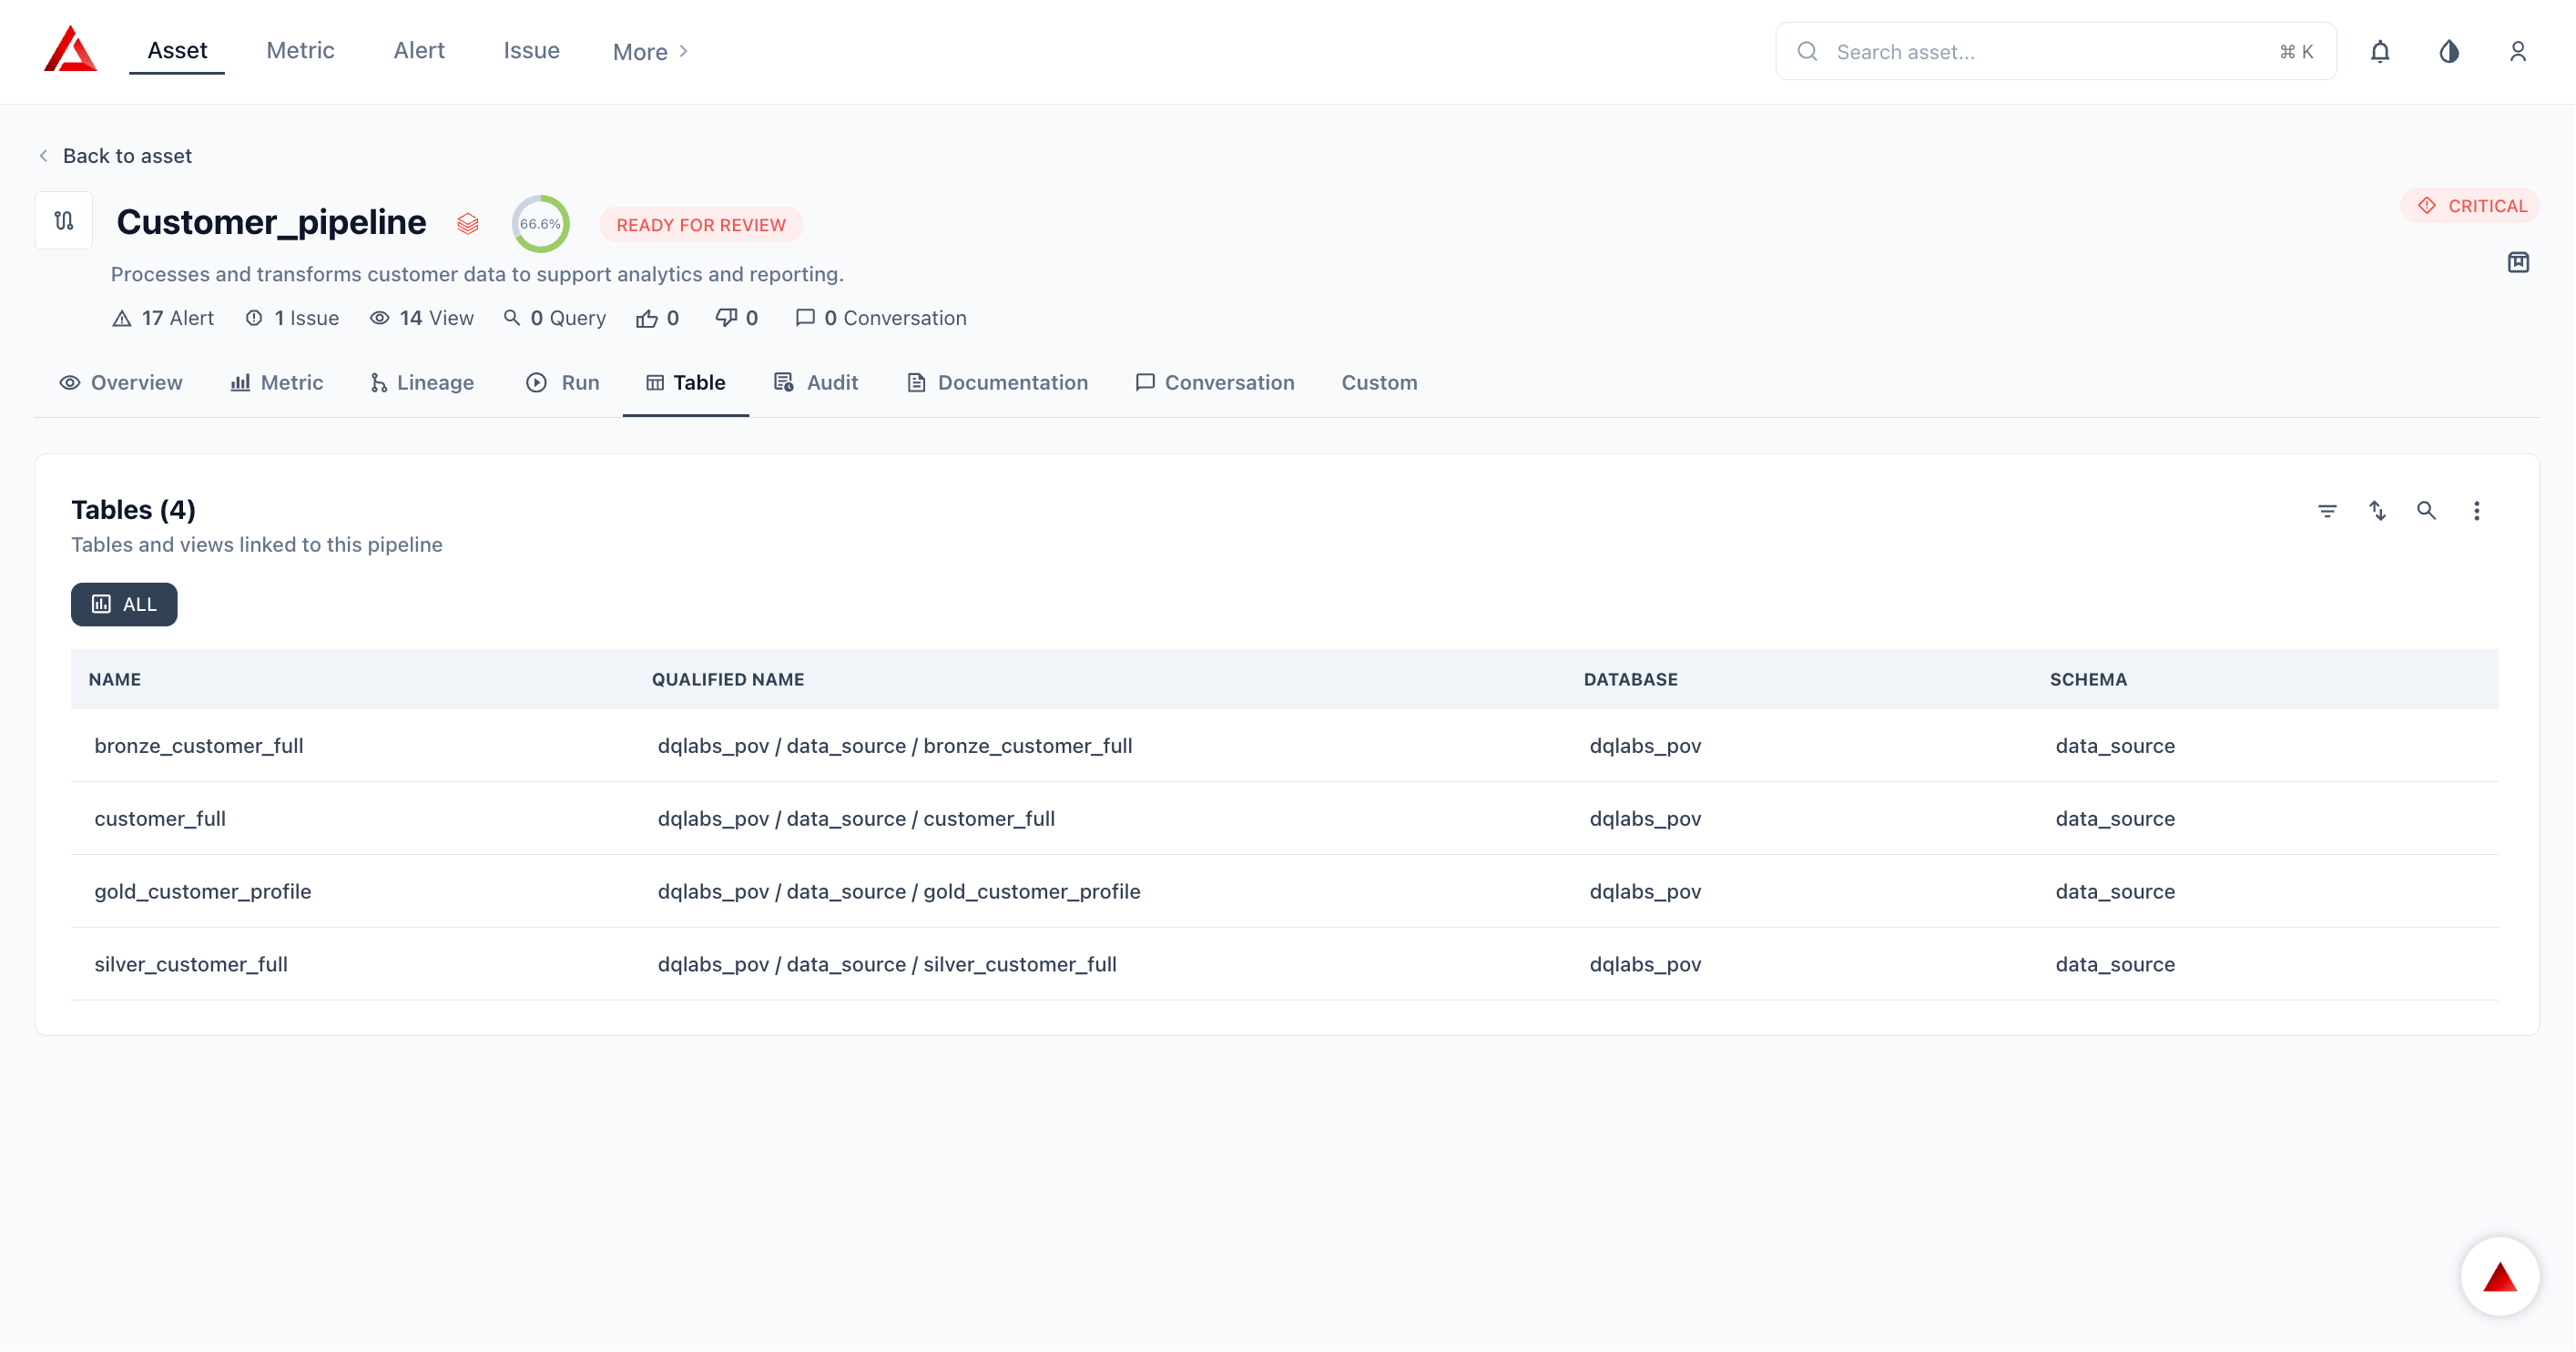 | **Column** | **What Prizm Shows** |
| :--------- | :------------------------------------------------ |
| **Name** | Fully qualified table name (catalog.schema.table) |
Tables listed here are the report data source tables associated with this pipeline run context. This view complements the Lineage tab with a flat list format for quick reference.
The Audit tab records every metadata change made to the pipeline asset in Prizm — owner updates, description edits, status changes, and configuration modifications.
| **Column** | **What Prizm Shows** |
| :--------- | :------------------------------------------------ |
| **Name** | Fully qualified table name (catalog.schema.table) |
Tables listed here are the report data source tables associated with this pipeline run context. This view complements the Lineage tab with a flat list format for quick reference.
The Audit tab records every metadata change made to the pipeline asset in Prizm — owner updates, description edits, status changes, and configuration modifications.
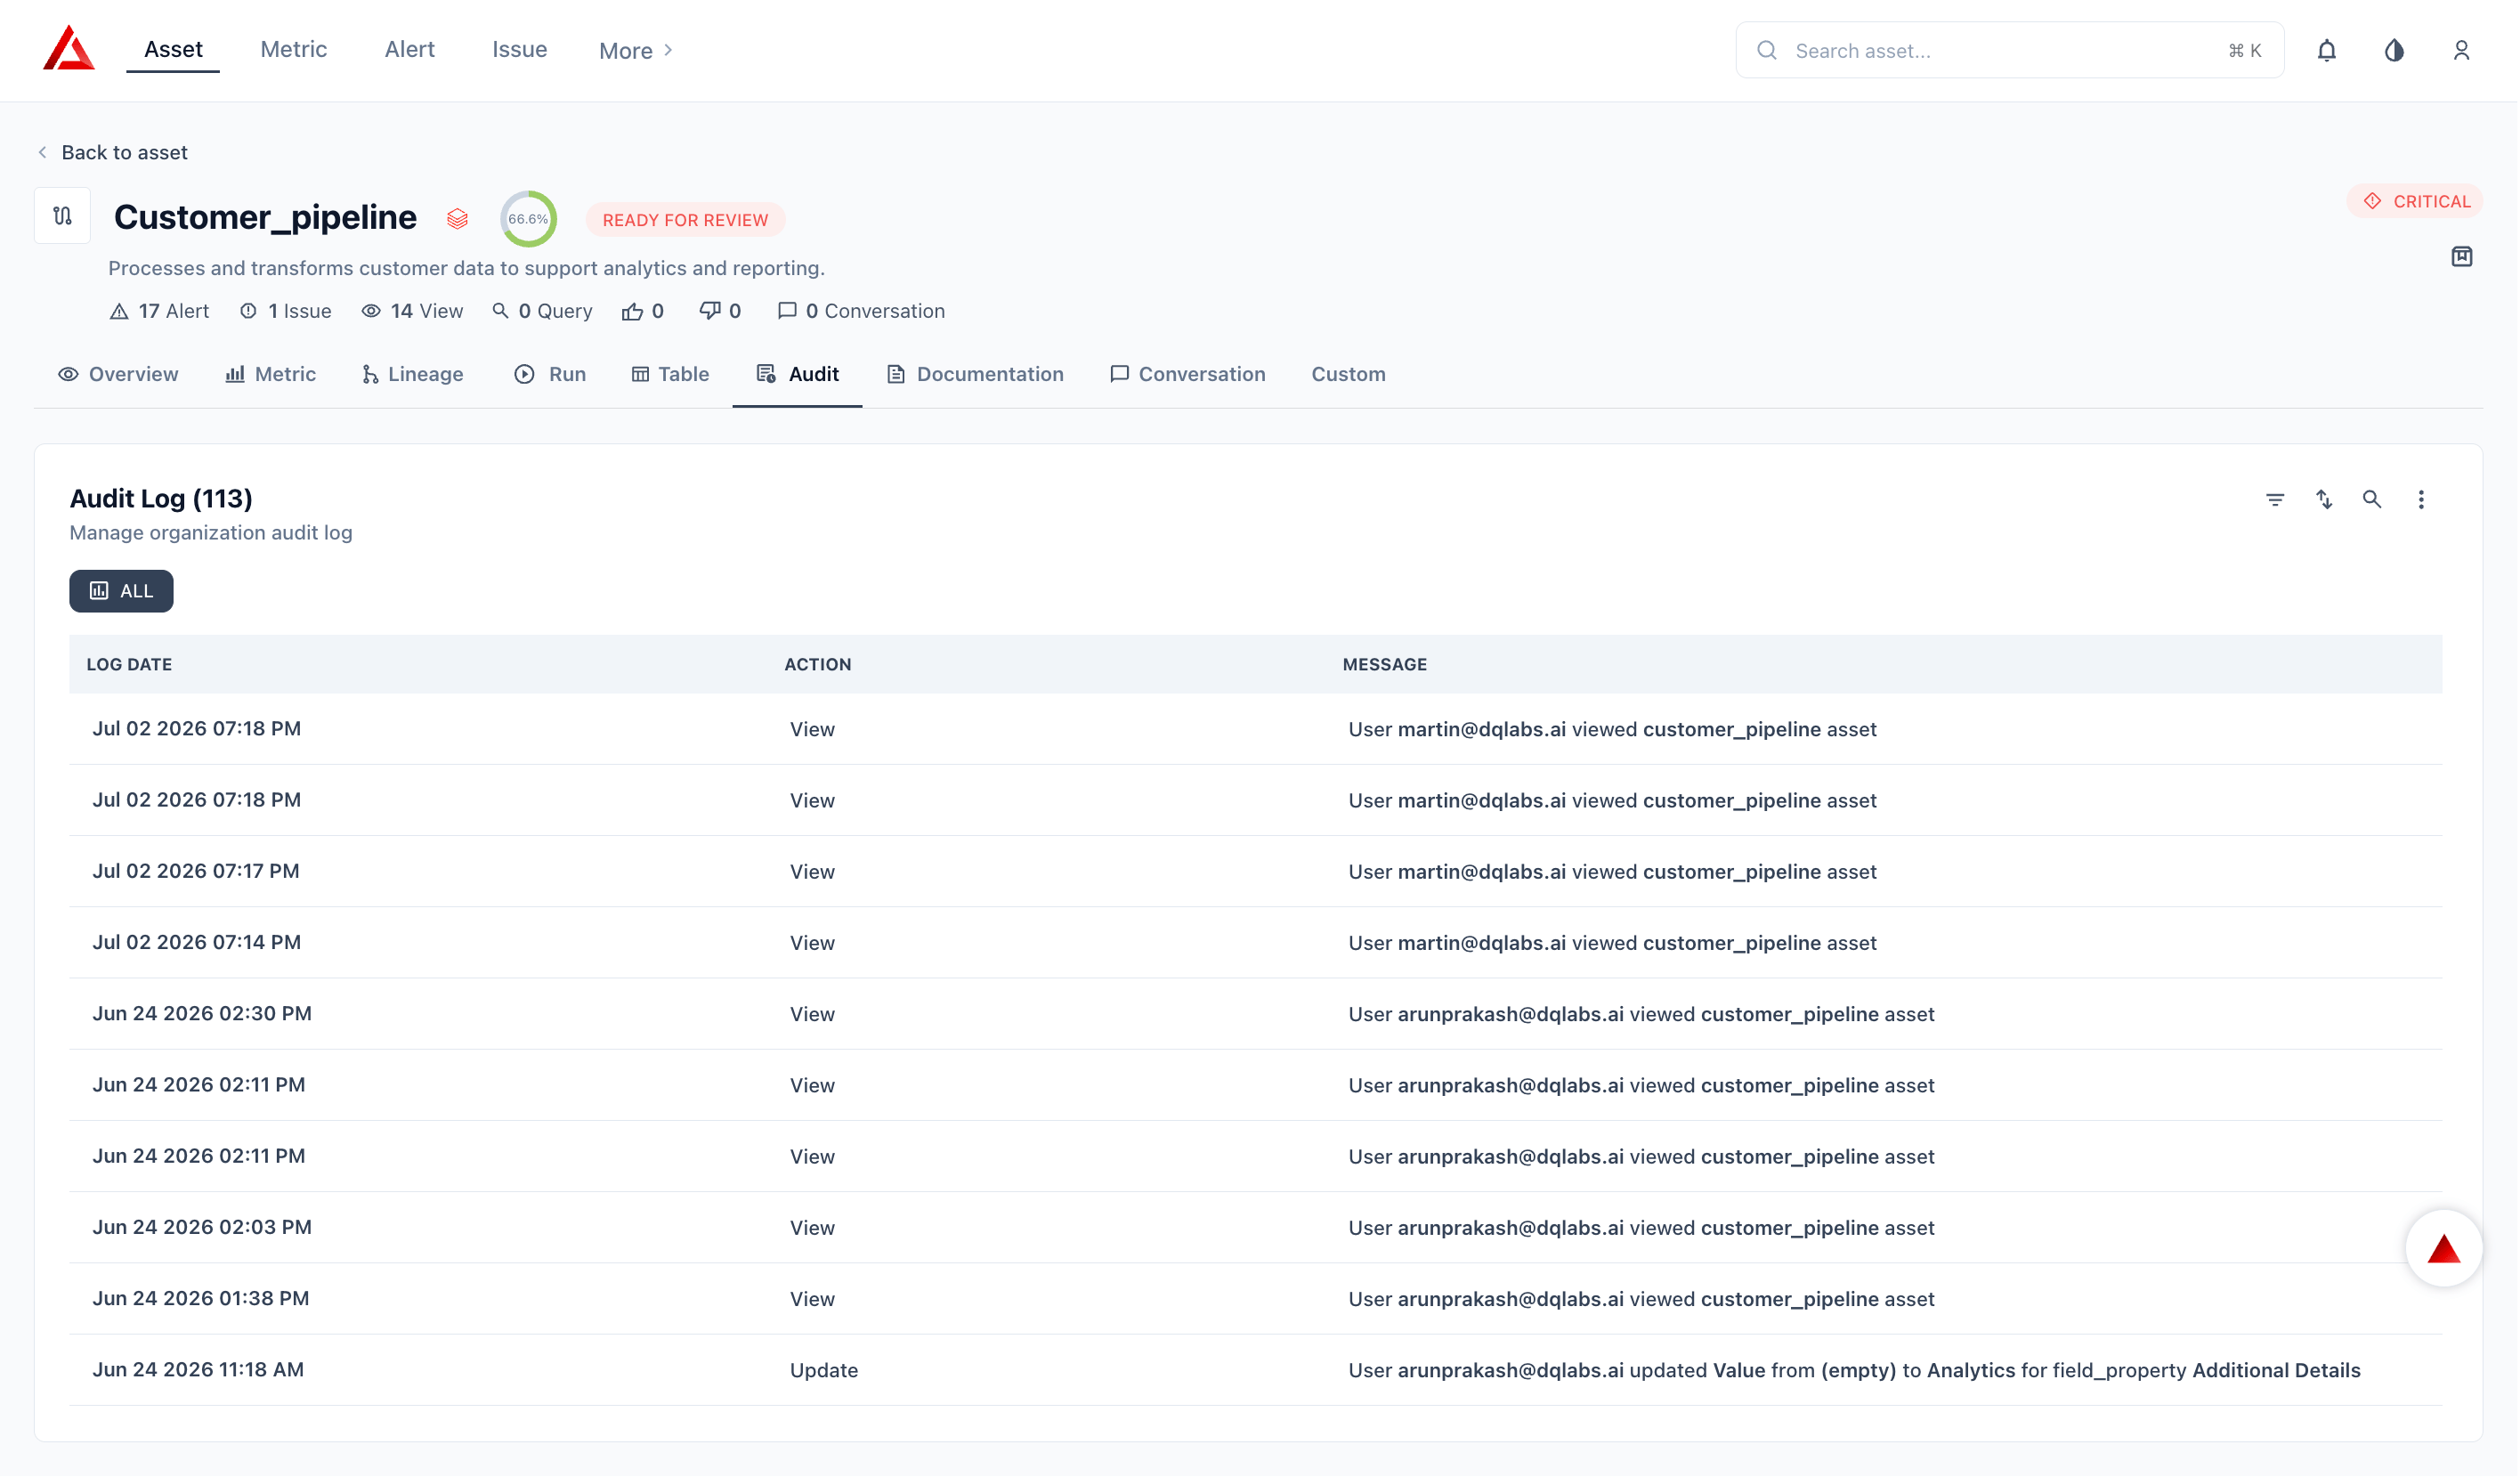 | **Column** | **What Prizm Shows** |
| :----------- | :------------------------------------------------------------------ |
| **Log Date** | Timestamp of the recorded action |
| **Action** | Type of change (metadata update, owner change, status update, etc.) |
| **Message** | Human-readable detail of what changed and by whom |
All records are immutable — entries cannot be edited or deleted from the UI.
## Next Steps
Connect Databricks to Prizm — prerequisites, authentication, and configuration.
Common questions about the Databricks connector.
| **Column** | **What Prizm Shows** |
| :----------- | :------------------------------------------------------------------ |
| **Log Date** | Timestamp of the recorded action |
| **Action** | Type of change (metadata update, owner change, status update, etc.) |
| **Message** | Human-readable detail of what changed and by whom |
All records are immutable — entries cannot be edited or deleted from the UI.
## Next Steps
Connect Databricks to Prizm — prerequisites, authentication, and configuration.
Common questions about the Databricks connector.