> ## Documentation Index
> Fetch the complete documentation index at: https://docs.dqlabs.ai/llms.txt
> Use this file to discover all available pages before exploring further.
# What Prizm Collects from dbt
> Artifacts Prizm ingests from dbt and how dbt objects appear in the Prizm UI.
Prizm runs two platform jobs against each dbt connector:
**Type:** CONTEXT — runs once after setup is complete.
Parses `manifest.json` to build the full dbt catalog: models, sources, tests, exposures, columns, lineage, tags, and owners. All subsequent jobs and UI views depend on this completing successfully.
| Object | Fields Captured |
| :----------- | :--------------------------------------------------------------------------------------------- |
| **Model** | Name, database, schema, materialization, dependencies, tags, owner, description, compiled SQL |
| **Source** | Name, database, schema, table, freshness thresholds, loaded-at field, tags, owner, description |
| **Test** | Name, type (generic / singular), severity, attached model/column, tags, description |
| **Exposure** | Name, type, upstream models, owner, maturity, tags, description |
| **Column** | Name, data type, description, parent model, associated tests, tags |
`catalog.json` is optional and enriches column data types with warehouse-introspected values. `semantic_manifest.json` is ingested if present — full metric UI support coming soon.
**Type:** TRUST — re-runs on every artifact push (dbt Core) or webhook event (dbt Cloud).
Ingests `run_results.json` and `sources.json` to power run history, test pass rates, model health trends, alerting, and freshness tracking.
| Signal | Source | What It Powers |
| :------------------- | :----------------- | :----------------------------------------------------- |
| **Job Run** | `run_results.json` | Run history, job health cards |
| **Model Run Result** | `run_results.json` | Execution time graphs, failure alerting, rows affected |
| **Test Run Result** | `run_results.json` | Test pass rate, failure issues |
| **Source Freshness** | `sources.json` | Freshness SLA tracking on source assets |
***
## What You See in Prizm
### dbt Job Page
Access from **Home Page → View All → Jobs** **→ DBT**
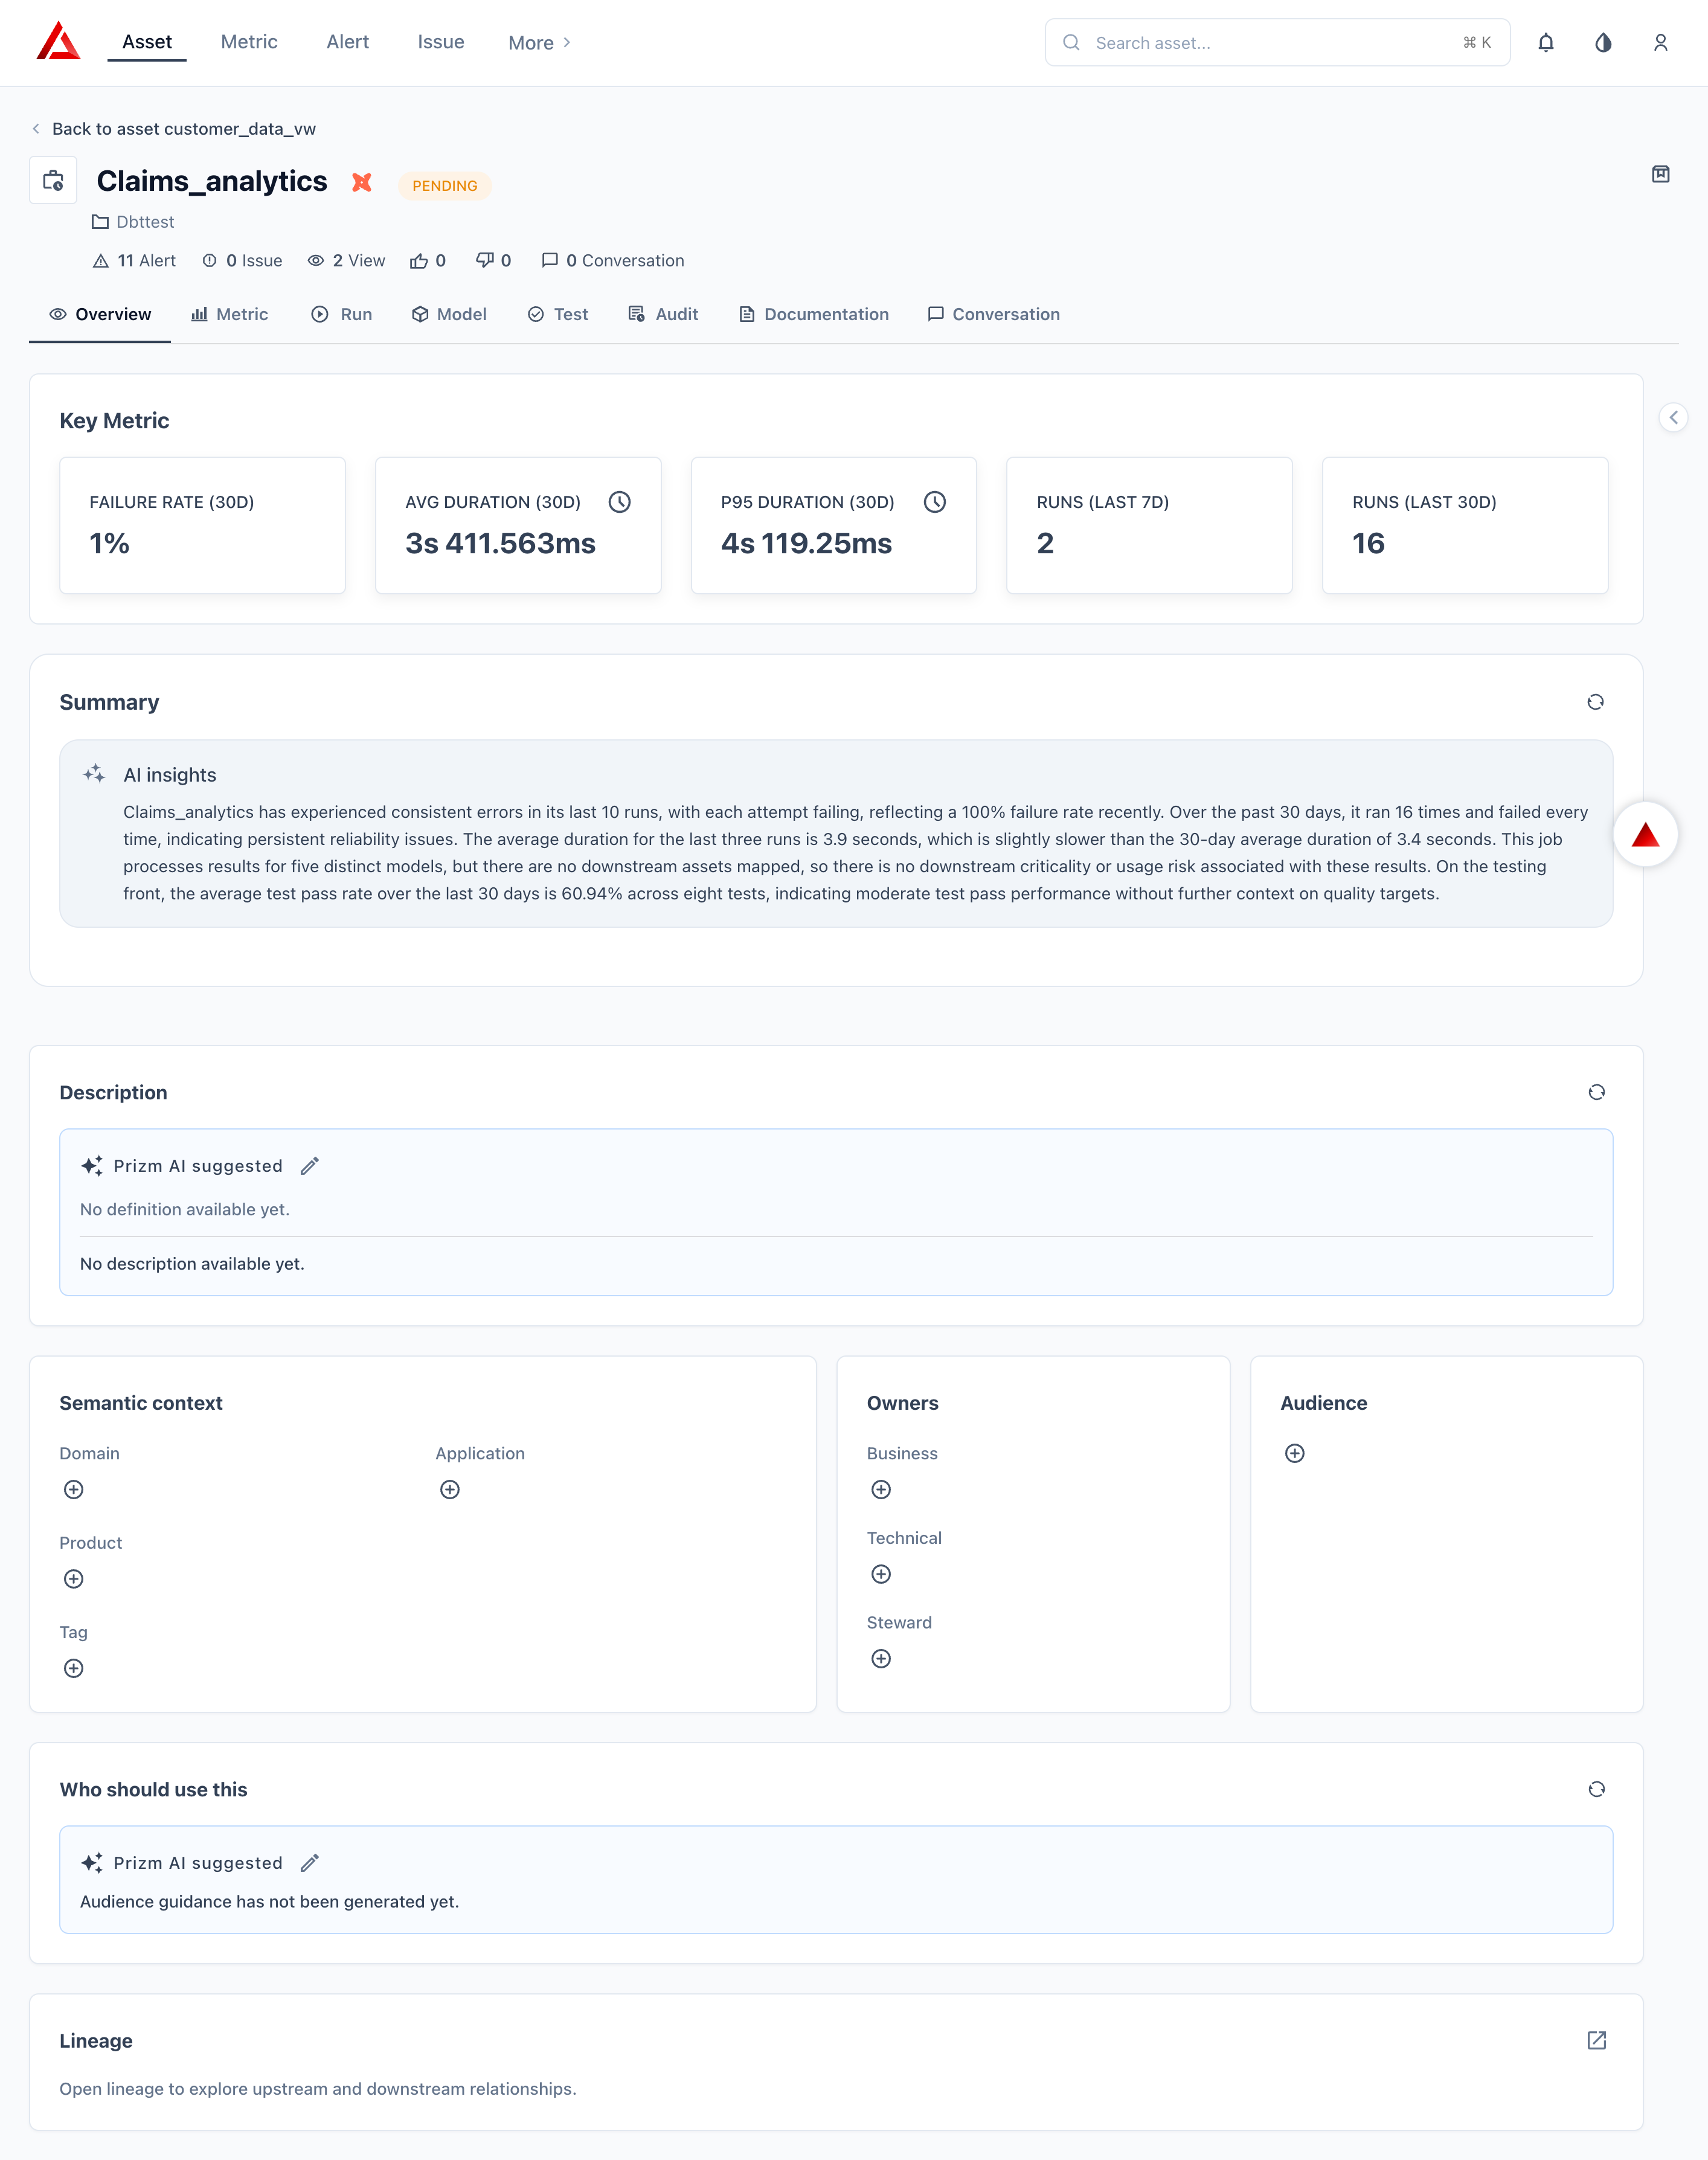
Health snapshot of the dbt job powered by the last 30 days of run data.
**Key Metric Cards:** Failure Rate (30D), Avg Duration (30D), P95 Duration (30D), Runs (Last 7D), Runs (Last 30D).
Prizm also surfaces AI risk signals — duration regression, recurring failures, high-impact job, and test degradation.
**Right Side Panel — More Info:** Qualified Name, Source Name, Type (JOB), Execution Mode, Job ID, Last Run At, Modified At,
DBT Cloud Specific Metadata: Environment, Job Schedule
 | Metric | Category |
| :---------------- | :----------- |
| Execution Status | Availability |
| Job Run Freshness | Availability |
| Job Duration | Usage |
| Job Success Rate | Queries |
Full run history. Columns: **Run ID**, **Status**, **Error**, **Duration**, **Trigger**, **Environment**, **Started At**.
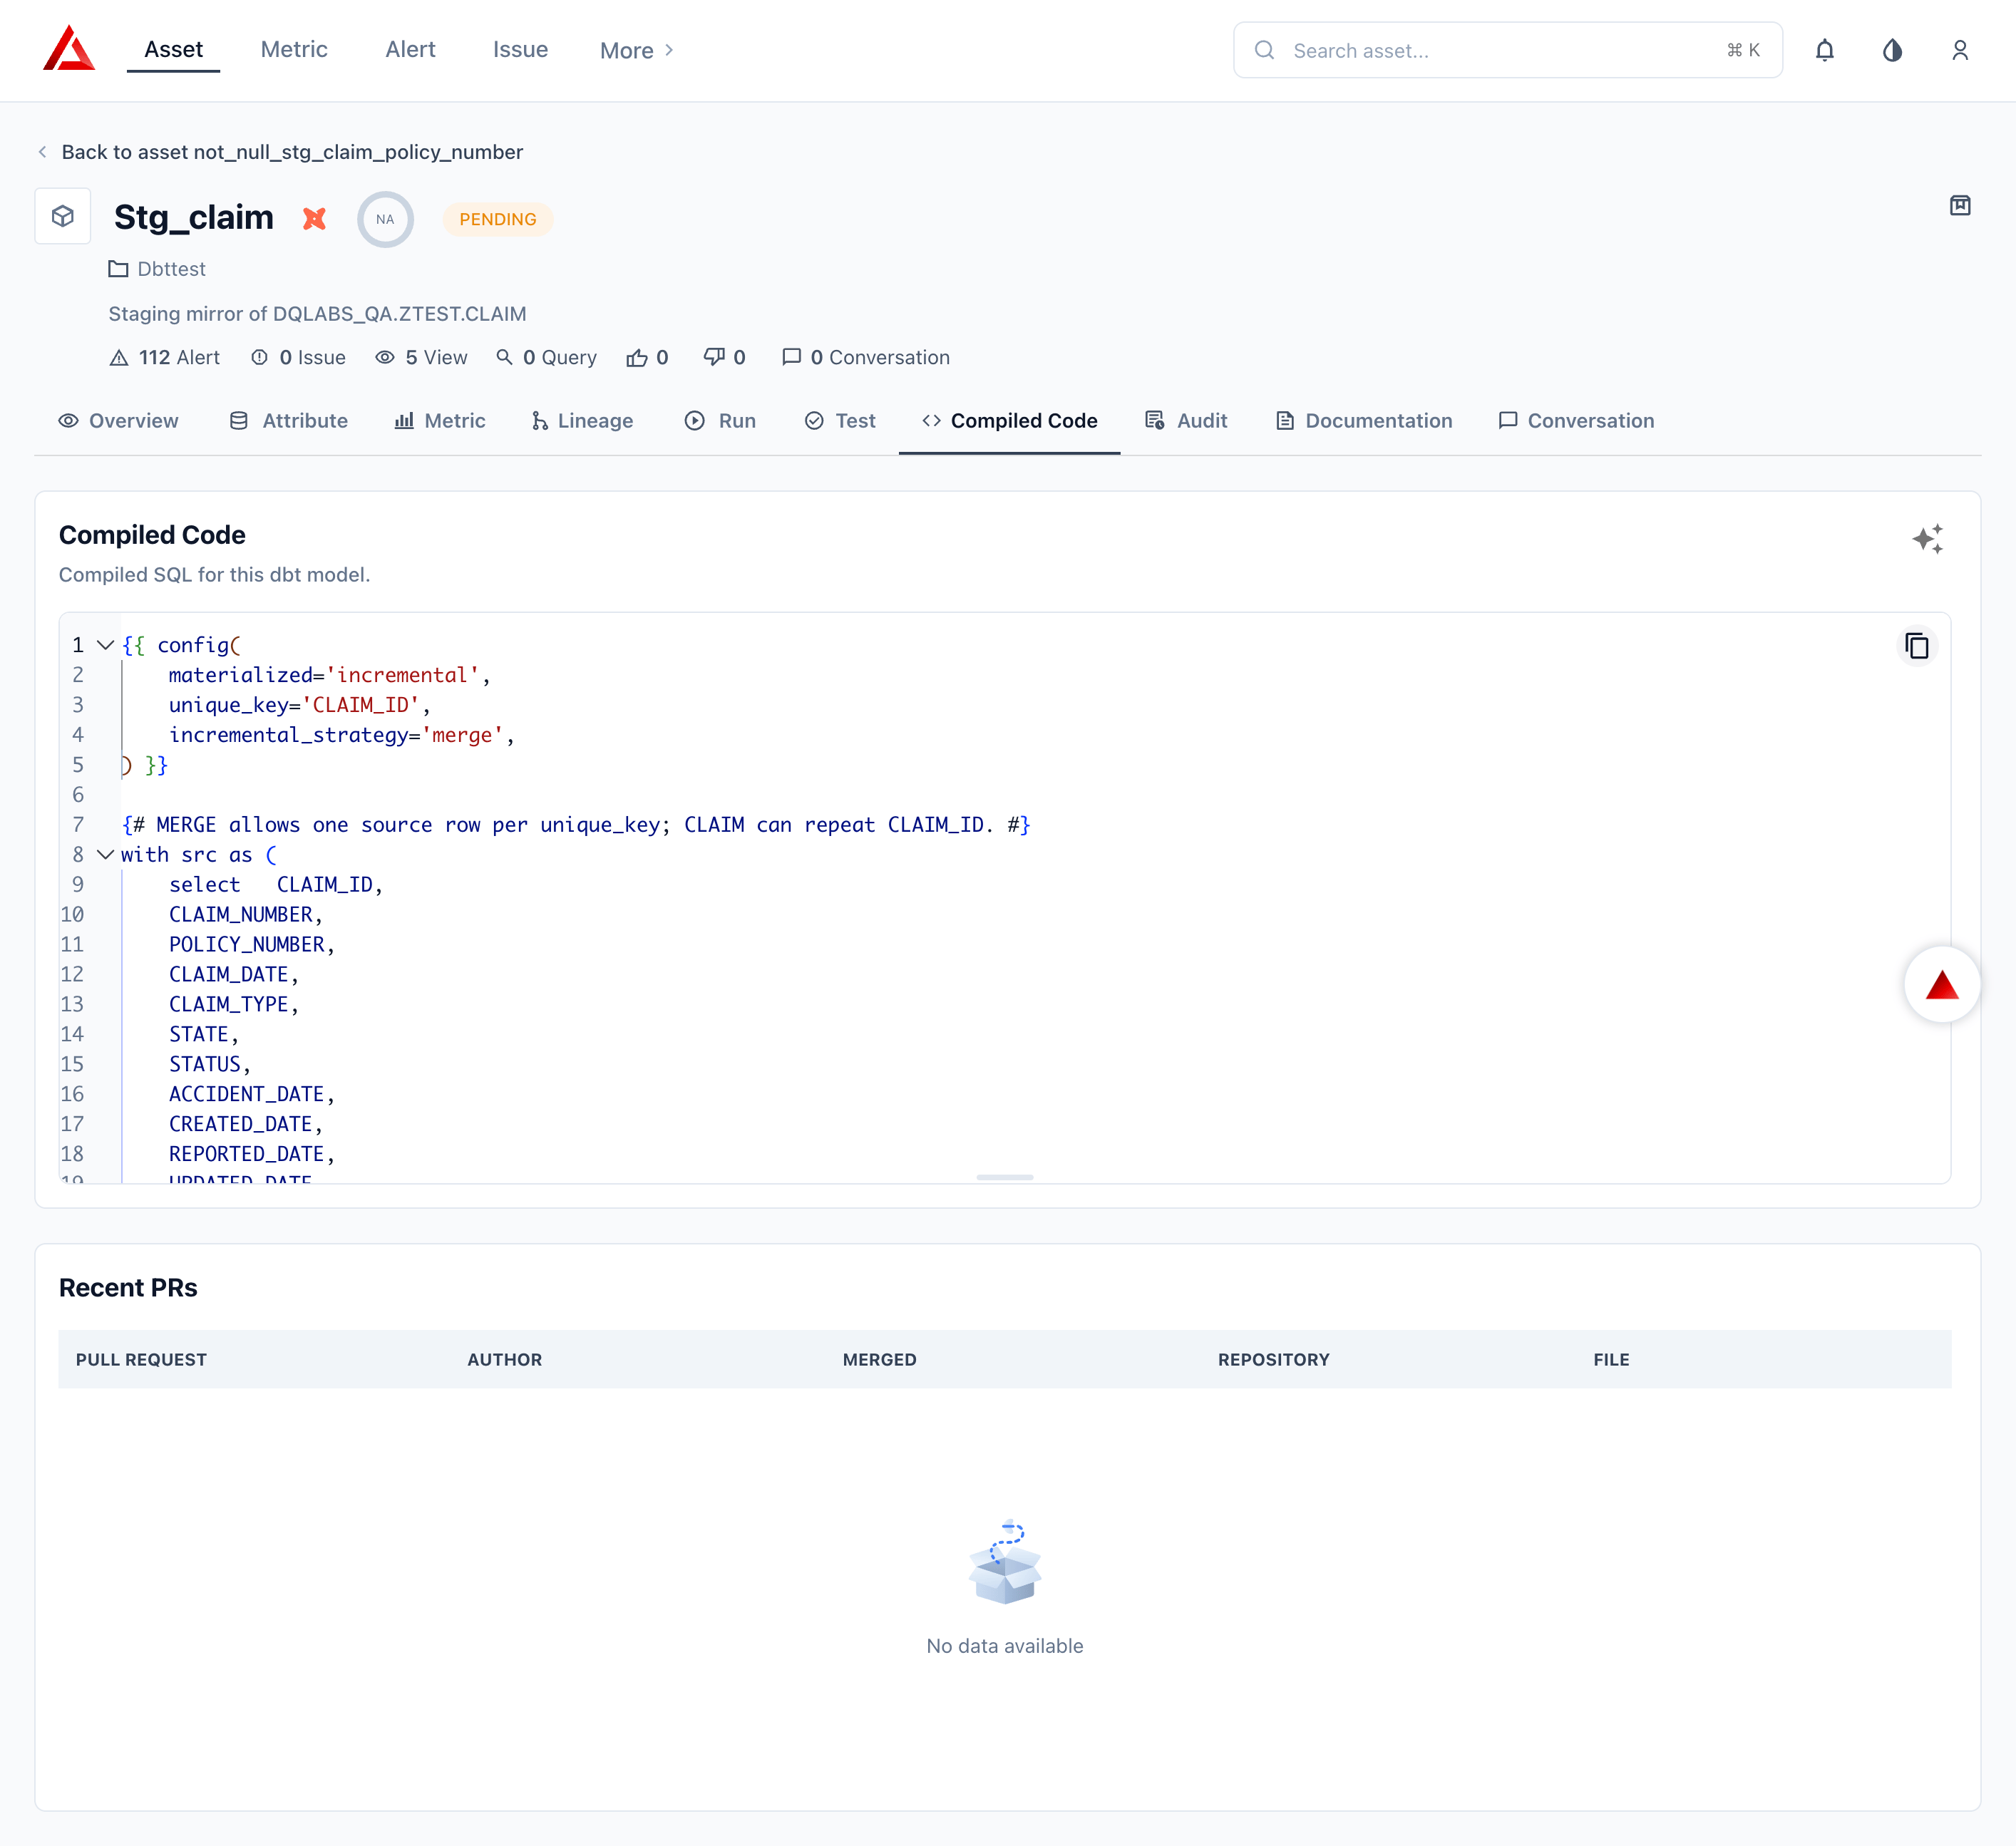
Click any row to open the **Run Detail Drawer** — Gantt-style timeline of the run plus a Run Result table with Model and Test sub-tabs. Each sub-tab shows: Name, Project Name, Job Name, Status, Execution Time.
All models touched by this job.
Columns: **Name**, **Materialization**, **Last Runs**, **Avg Duration (30D)**, **Failure Count (30D)**.
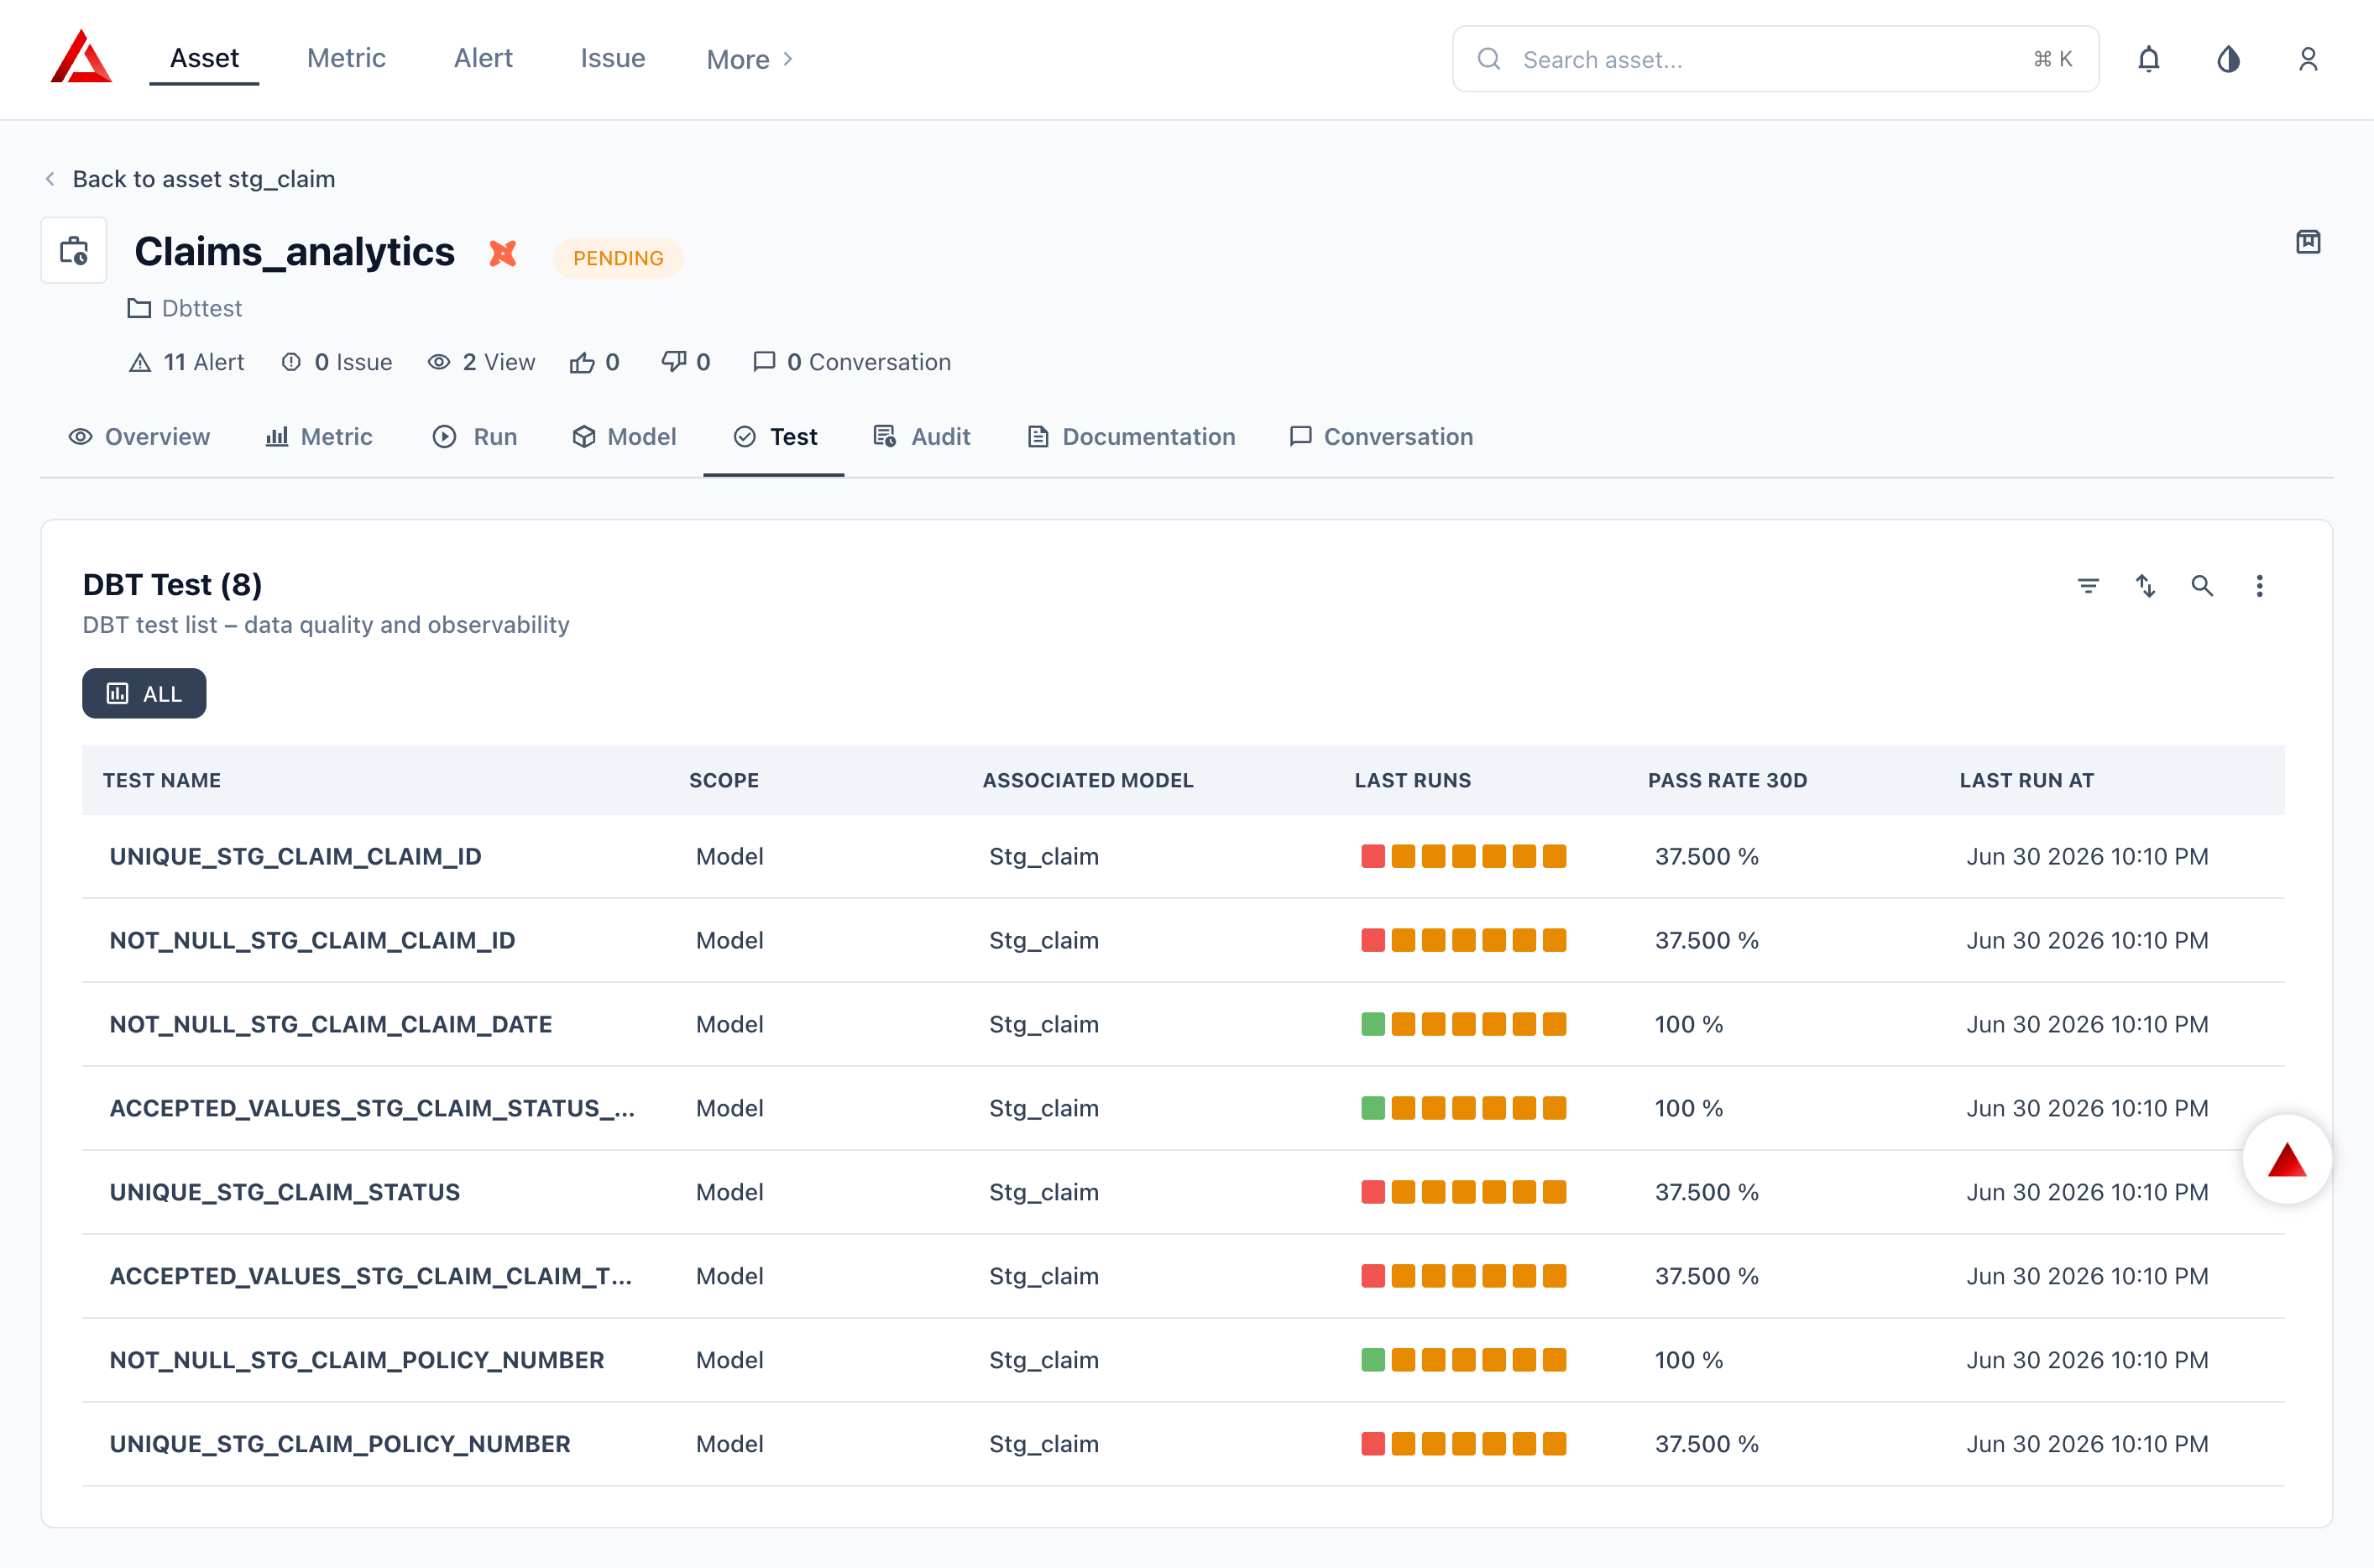
All tests in scope for this job.
Columns: **Test Name**, **Scope**, **Associated Model**, **Last Runs**, **Pass Rate 30D**, **Last Run At**.
| Metric | Category |
| :---------------- | :----------- |
| Execution Status | Availability |
| Job Run Freshness | Availability |
| Job Duration | Usage |
| Job Success Rate | Queries |
Full run history. Columns: **Run ID**, **Status**, **Error**, **Duration**, **Trigger**, **Environment**, **Started At**.
Click any row to open the **Run Detail Drawer** — Gantt-style timeline of the run plus a Run Result table with Model and Test sub-tabs. Each sub-tab shows: Name, Project Name, Job Name, Status, Execution Time.
All models touched by this job.
Columns: **Name**, **Materialization**, **Last Runs**, **Avg Duration (30D)**, **Failure Count (30D)**.
All tests in scope for this job.
Columns: **Test Name**, **Scope**, **Associated Model**, **Last Runs**, **Pass Rate 30D**, **Last Run At**.
 ***
### dbt Model Asset Page
***
### dbt Model Asset Page
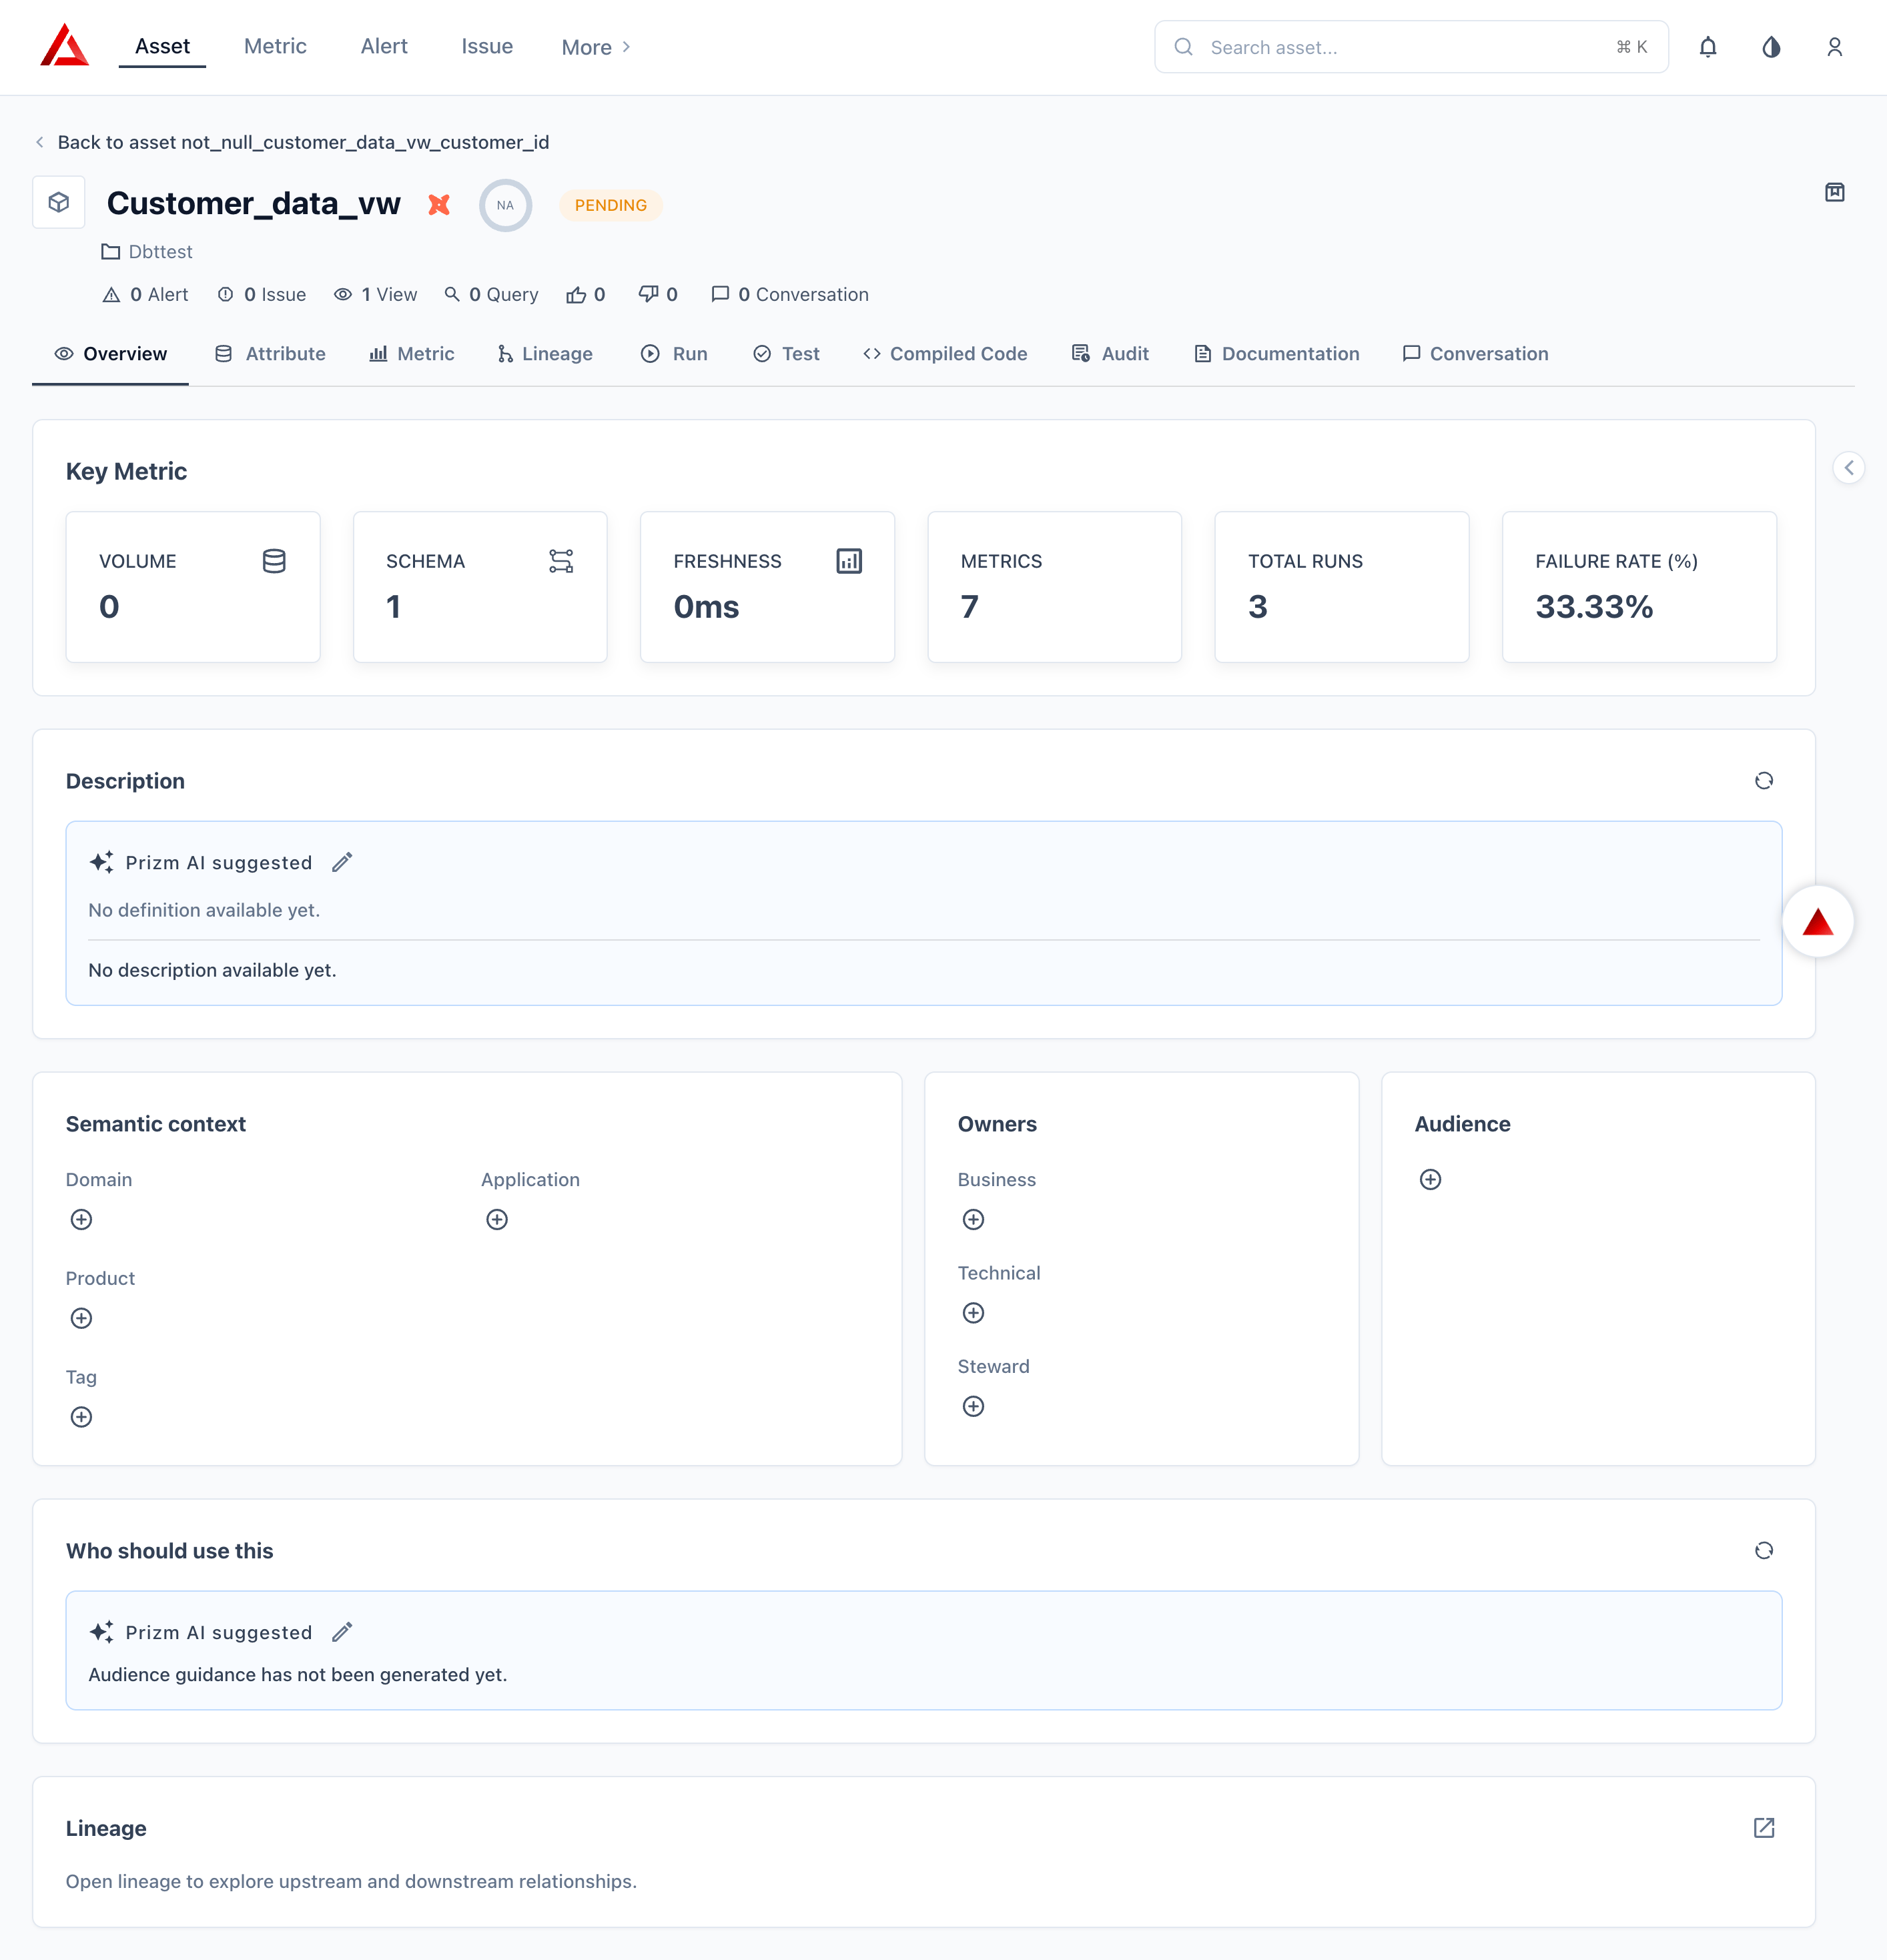 **Key Metric Cards:** Volume, Schema, Freshness, Metrics, Total Runs, Failure Rate (%).
**Right Side Panel:** Qualified Name, Source Name, Type, Materialization, Materializes To (linked warehouse table), Alias, dbt Owner, dbt Tags, Database, Schema, Execution Mode.
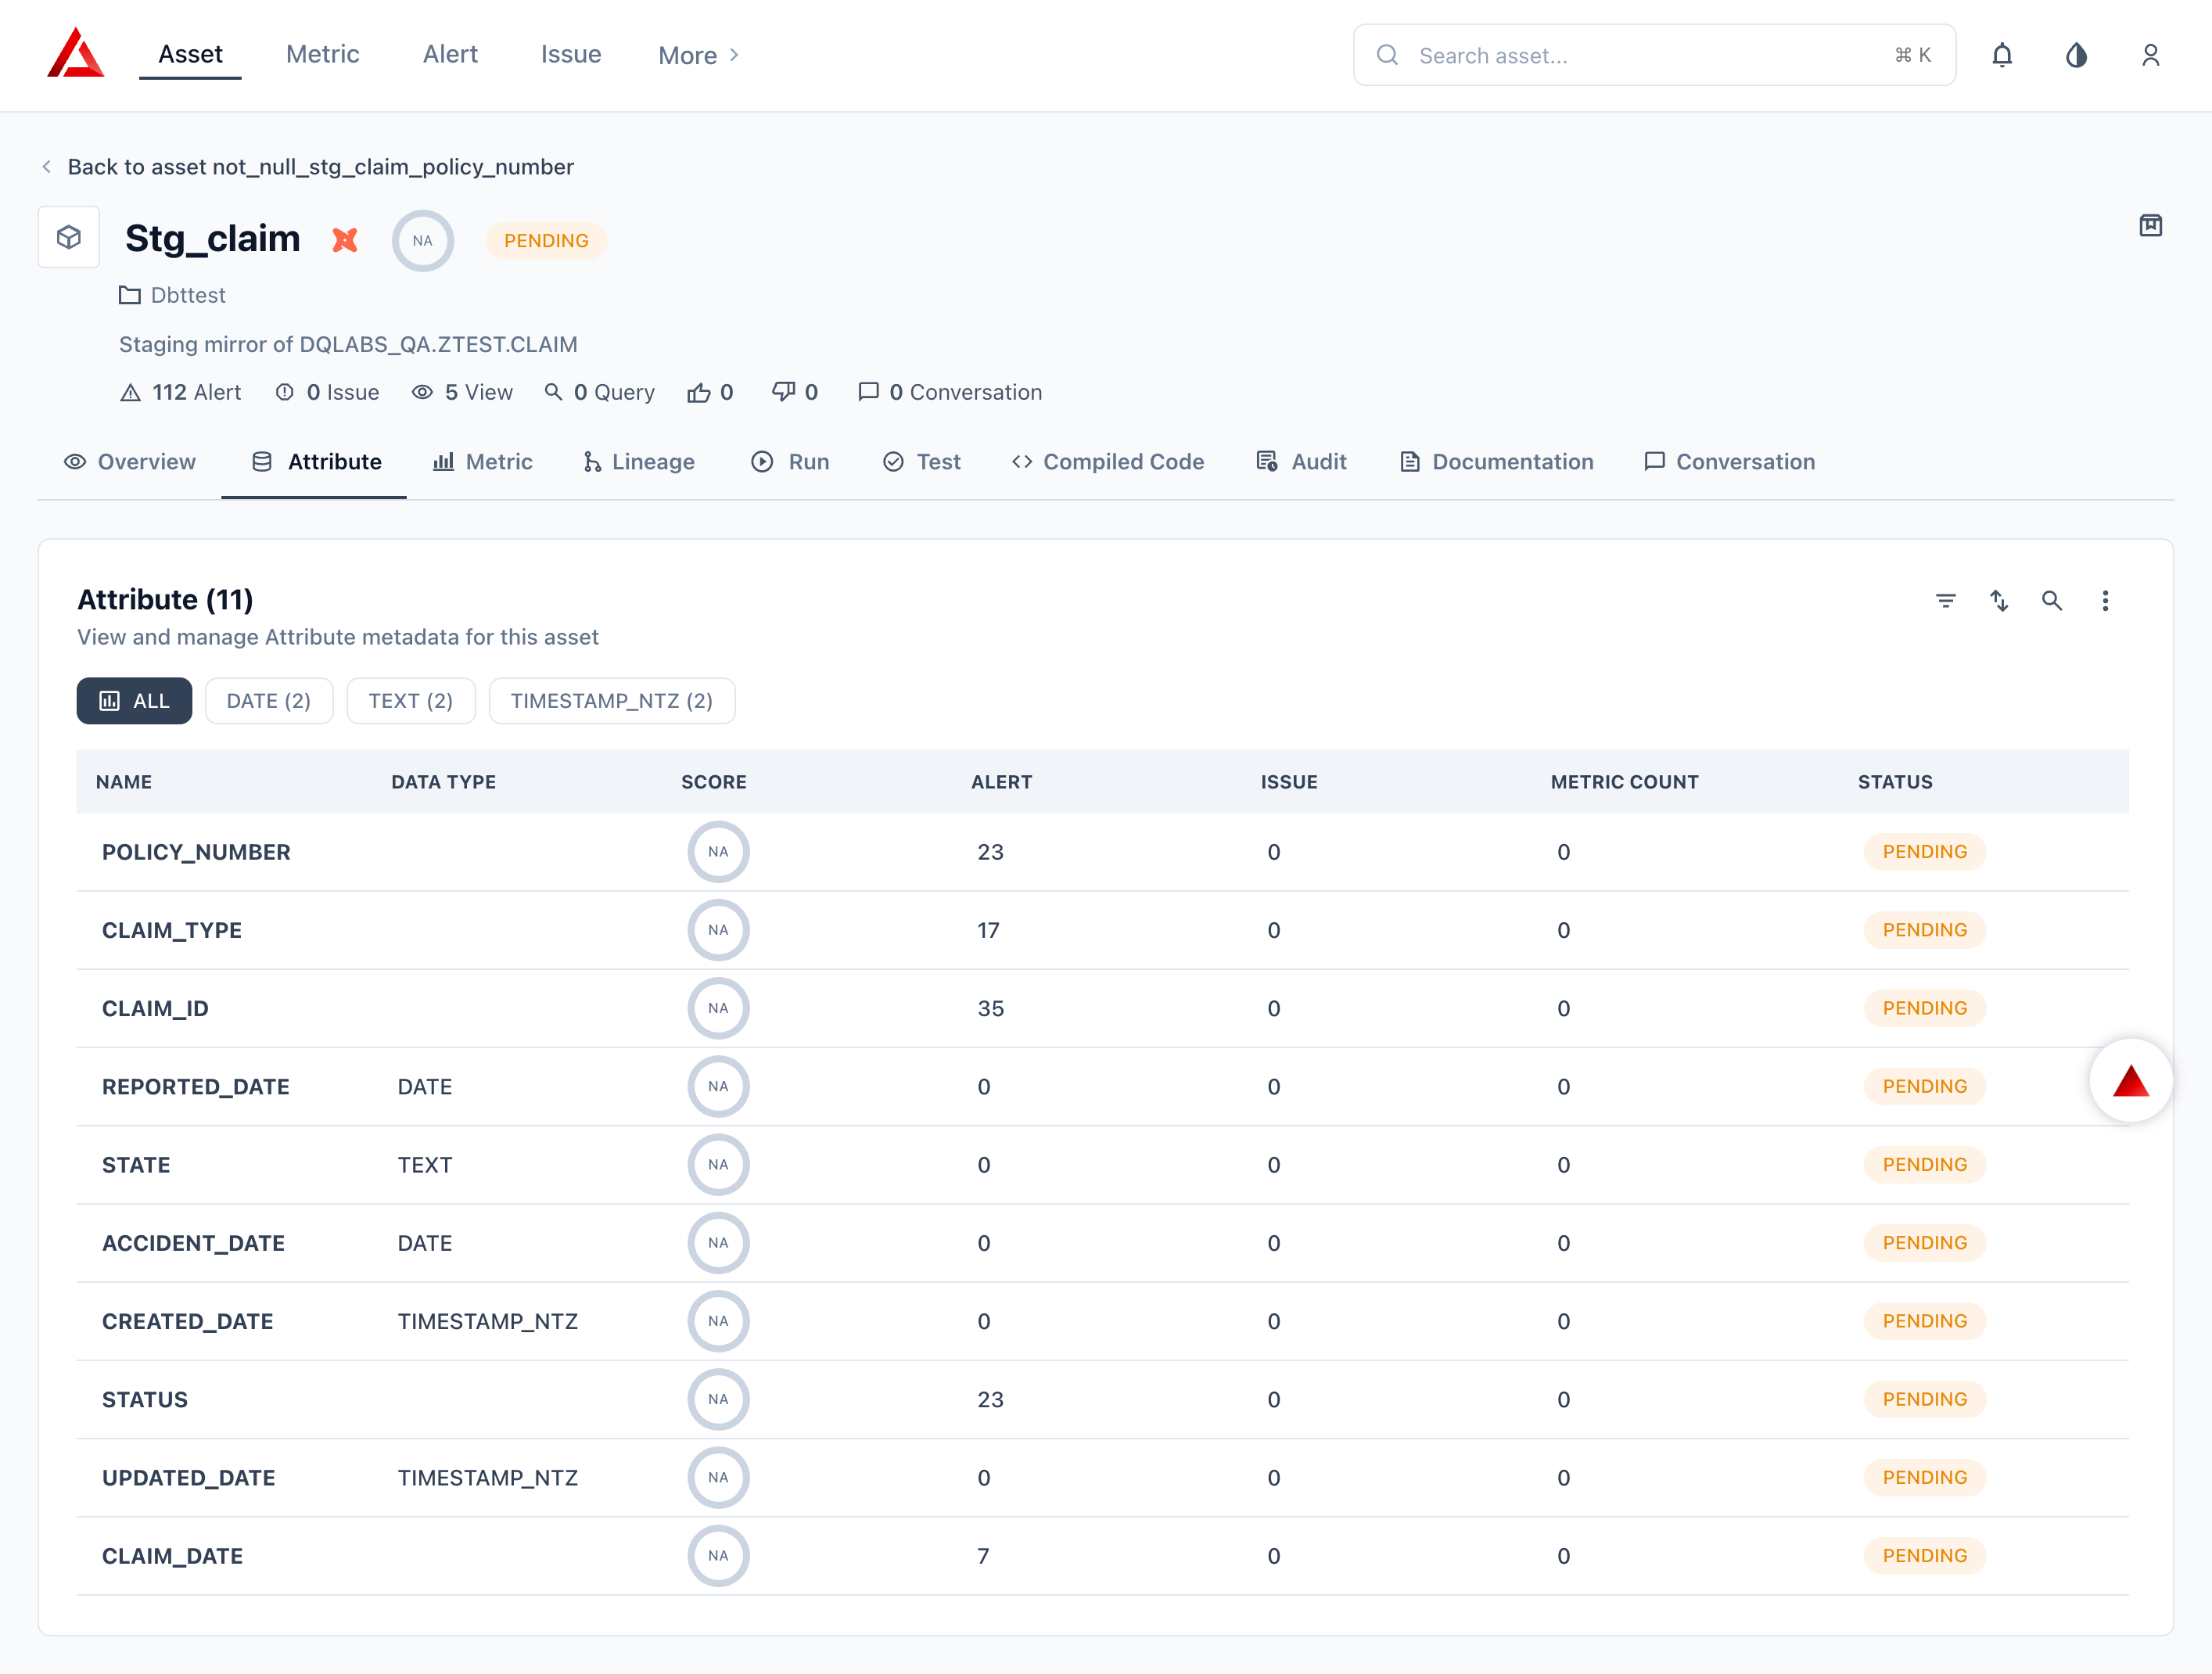
Column-level metadata. Columns: **Name**, **Data Type**.
**Key Metric Cards:** Volume, Schema, Freshness, Metrics, Total Runs, Failure Rate (%).
**Right Side Panel:** Qualified Name, Source Name, Type, Materialization, Materializes To (linked warehouse table), Alias, dbt Owner, dbt Tags, Database, Schema, Execution Mode.
Column-level metadata. Columns: **Name**, **Data Type**.
 | Metric | Category |
| :--------------- | :----------- |
| Run Success Rate | Queries |
| Execution Time | Usage |
| Rows Affected | Availability |
| Freshness | Availability |
Directed lineage graph. Default view shows dbt models as transformation **edges** between warehouse tables. Toggle to dbt-only mode to see model-to-model dependencies as **nodes**. Column-level lineage is available.
Execution history across all jobs. Columns: **Run ID**, **Status**, **Error**, **Duration**, **Trigger**, **Environment**, **Started At**.
| Metric | Category |
| :--------------- | :----------- |
| Run Success Rate | Queries |
| Execution Time | Usage |
| Rows Affected | Availability |
| Freshness | Availability |
Directed lineage graph. Default view shows dbt models as transformation **edges** between warehouse tables. Toggle to dbt-only mode to see model-to-model dependencies as **nodes**. Column-level lineage is available.
Execution history across all jobs. Columns: **Run ID**, **Status**, **Error**, **Duration**, **Trigger**, **Environment**, **Started At**.
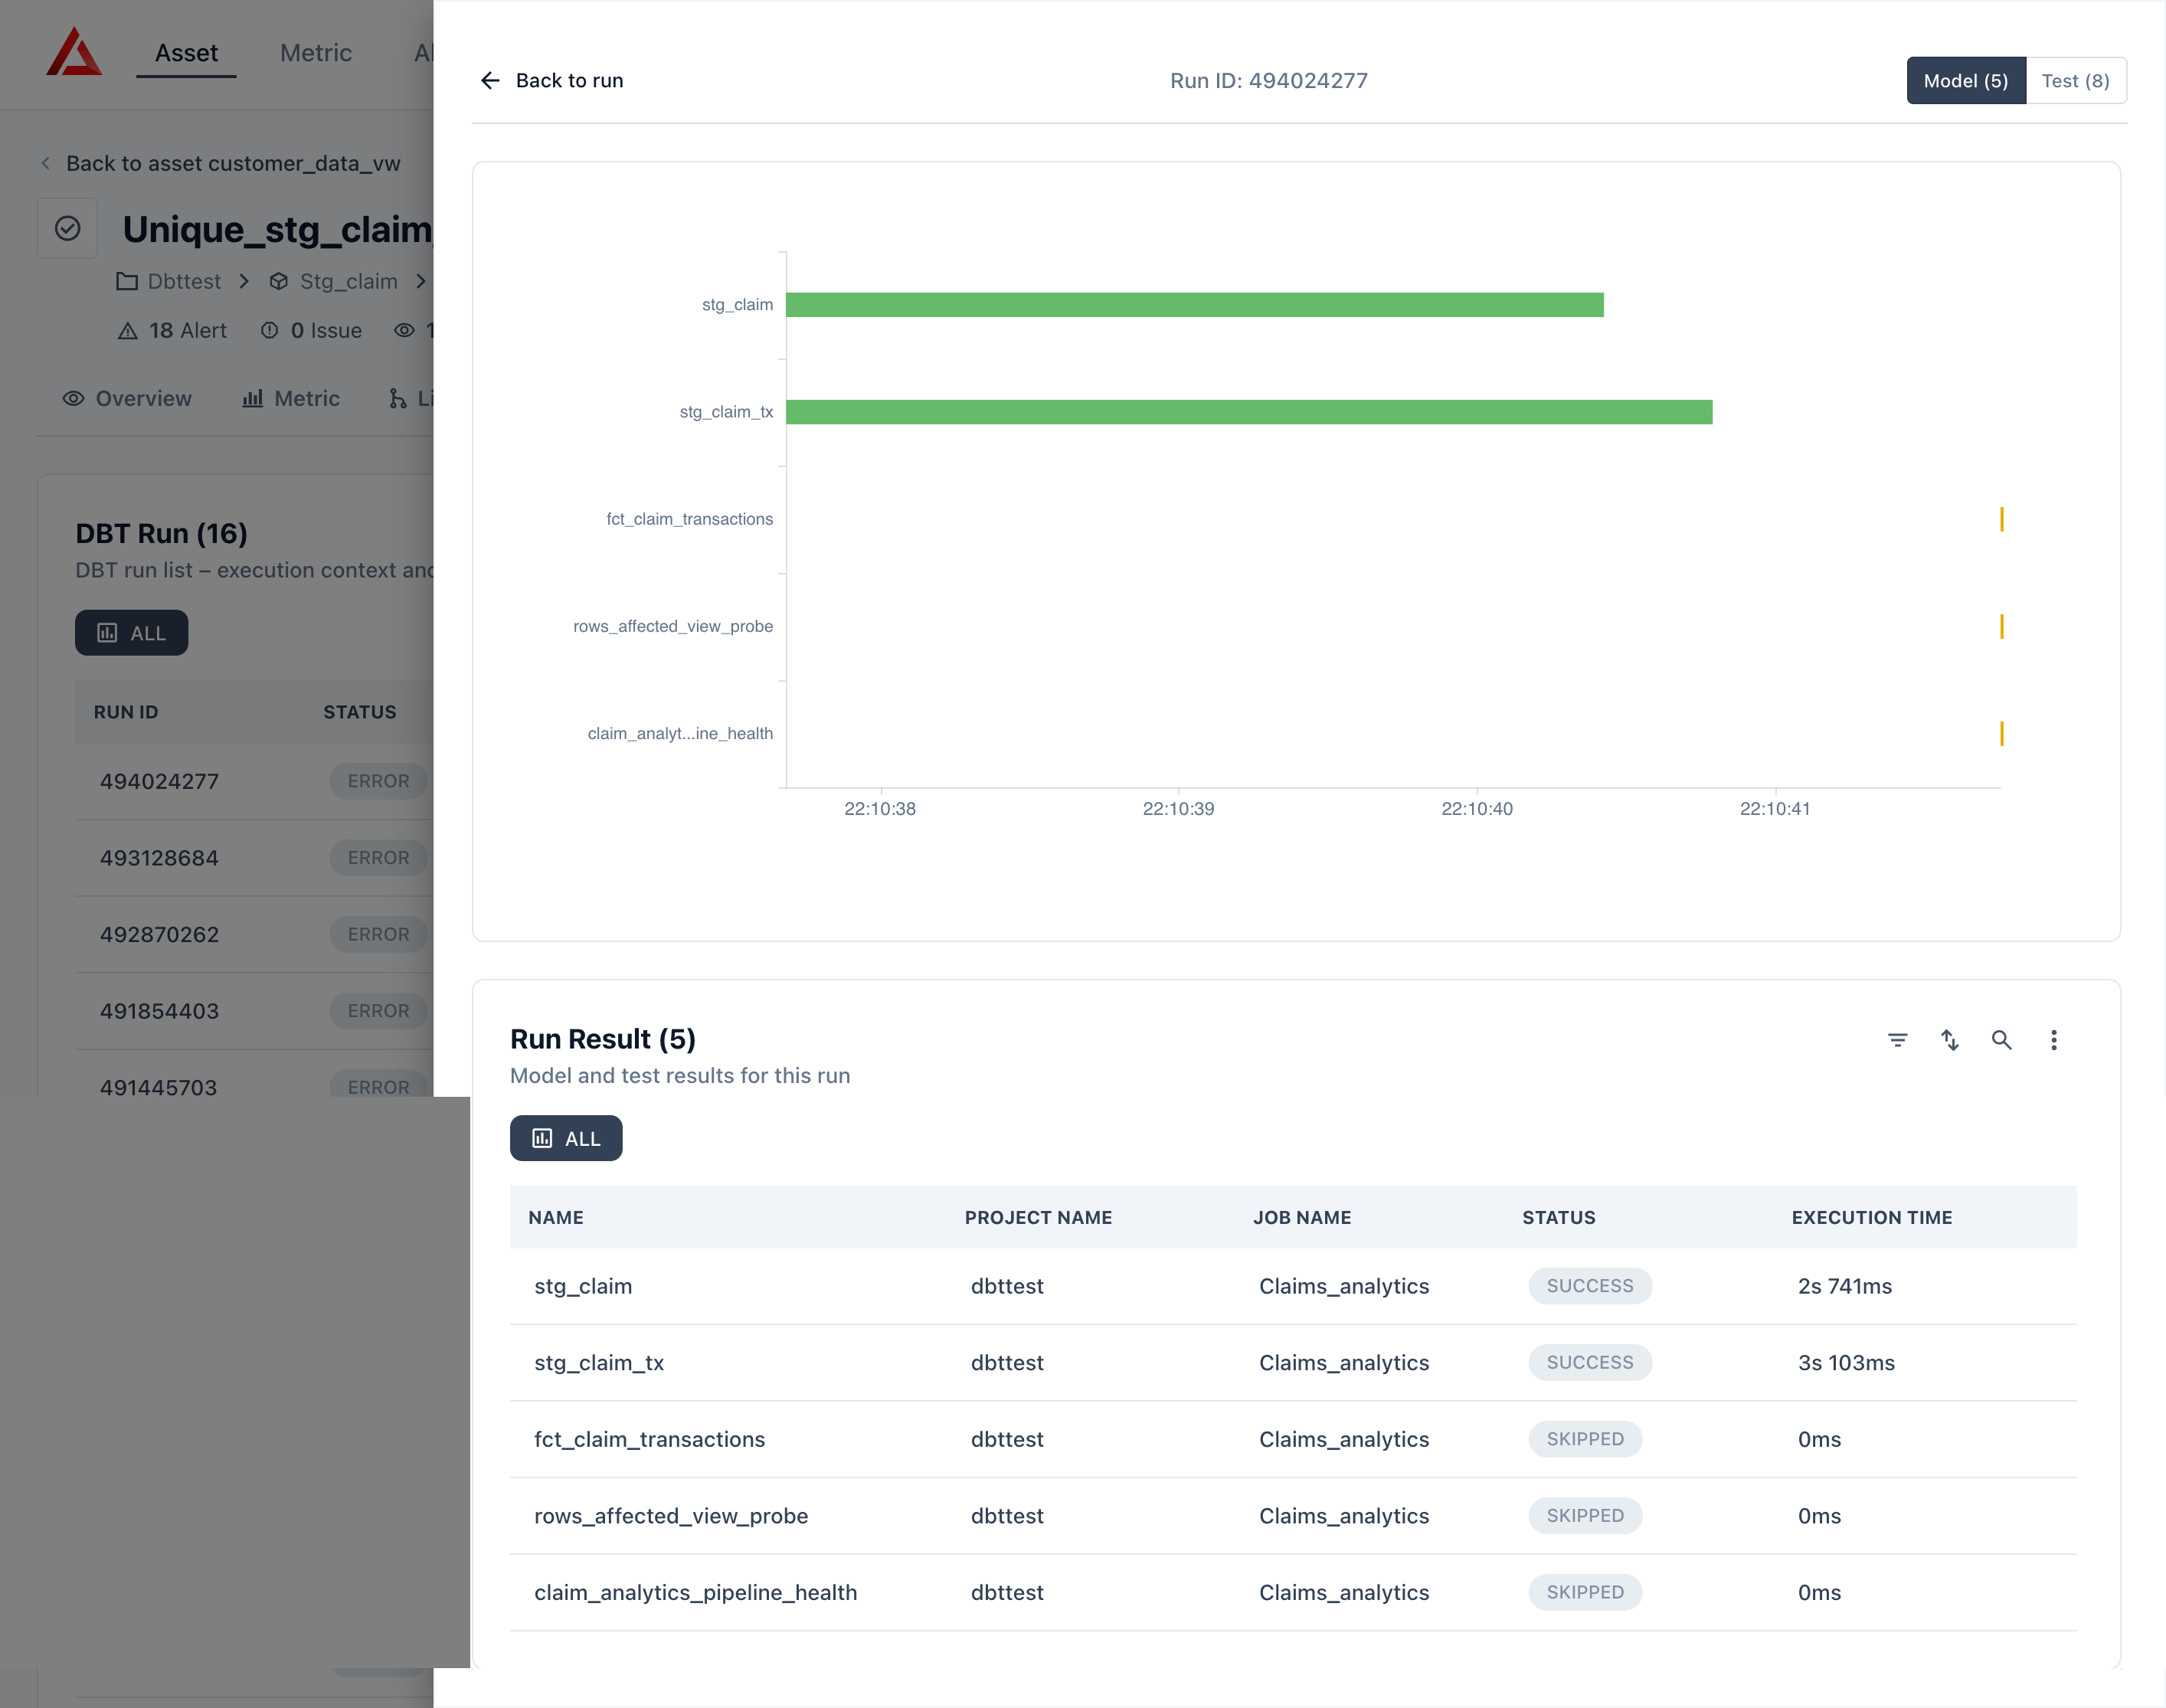 All configured tests. Columns: **Test Name**, **Column Name**, **Last Runs**, **Pass Rate 30D**, **Last Run At**.
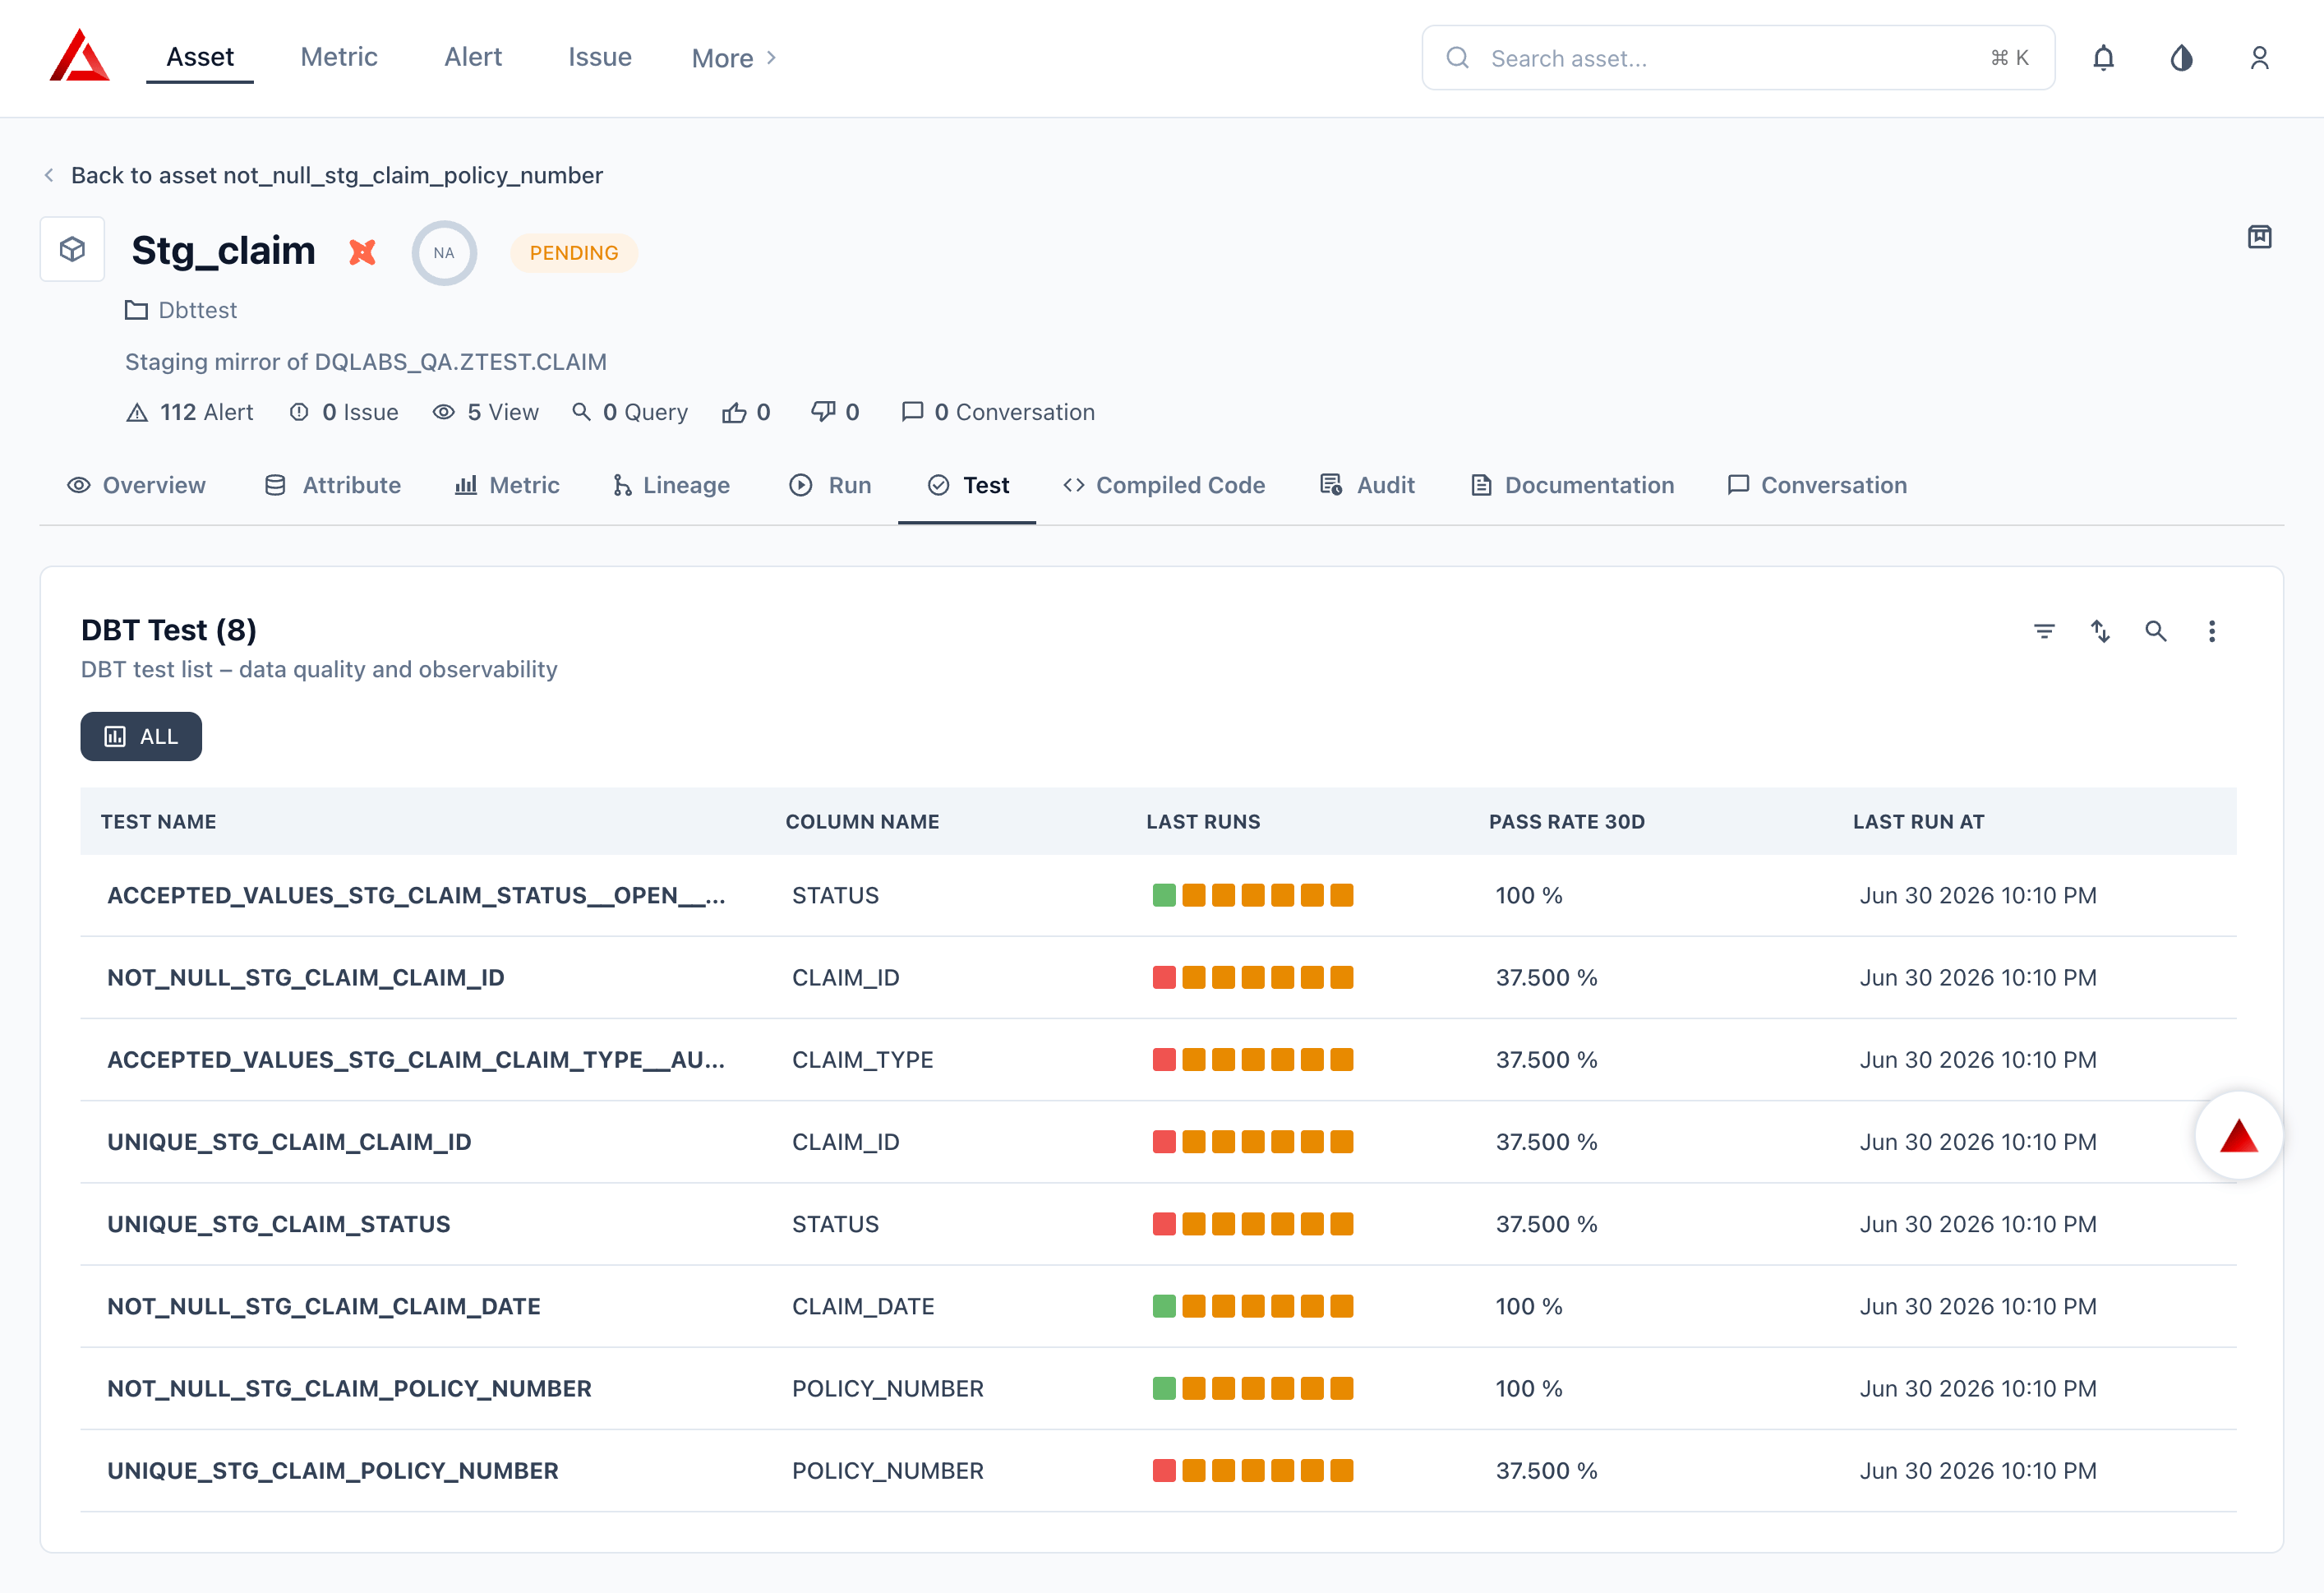 Final compiled SQL after Jinja and macro resolution. AI actions: **Explain** (plain-language summary) and **Improve Model** (dbt best-practice suggestions).
 ***
### dbt Test Asset Page
Each dbt test is a standalone asset in Prizm.
**Key Metric Cards:** Total Executions, Failures, Failure Rate (%).
Also shows Description, Semantic context, Owners, Audience, Who should use this, and inline Lineage showing the upstream model and column.
| Metric | Category |
| :------------------ | :---------- |
| Test Execution Time | Usage |
| Test Status | Conditional |
Execution history. Columns: **Run ID**, **Status**, **Error**, **Duration**, **Trigger**, **Environment**, **Started At**.
**Right Side Panel — More Info:** Qualified Name, Source Name, Type (TEST), Execution Mode, Severity (error / warn), Test Type (generic / singular), Created At, Modified At.
***
### dbt Exposure Asset Page
Each dbt exposure represents a downstream consumer (dashboard, notebook, application, ML pipeline).
**Tabs:** Overview, Lineage, Audit, Documentation, Conversation.
**Key Metric Cards:** Volume, Schema, Freshness, Metrics (inherited from upstream models).
Also shows Description, Semantic context, Owners, Audience, Who should use this, and inline Lineage showing the upstream model chain.
Full upstream graph tracing from raw warehouse sources through dbt models to the exposure endpoint.
Exposures have no Run, Test, Metric, or Compiled Code tabs — they are not executed by dbt. All quality and metric signals come from upstream models.
***
## Next Steps
Connect Prizm to dbt Cloud or configure the dbt Core CLI plugin.
Common questions about artifacts, lineage, and troubleshooting.
***
### dbt Test Asset Page
Each dbt test is a standalone asset in Prizm.
**Key Metric Cards:** Total Executions, Failures, Failure Rate (%).
Also shows Description, Semantic context, Owners, Audience, Who should use this, and inline Lineage showing the upstream model and column.
| Metric | Category |
| :------------------ | :---------- |
| Test Execution Time | Usage |
| Test Status | Conditional |
Execution history. Columns: **Run ID**, **Status**, **Error**, **Duration**, **Trigger**, **Environment**, **Started At**.
**Right Side Panel — More Info:** Qualified Name, Source Name, Type (TEST), Execution Mode, Severity (error / warn), Test Type (generic / singular), Created At, Modified At.
***
### dbt Exposure Asset Page
Each dbt exposure represents a downstream consumer (dashboard, notebook, application, ML pipeline).
**Tabs:** Overview, Lineage, Audit, Documentation, Conversation.
**Key Metric Cards:** Volume, Schema, Freshness, Metrics (inherited from upstream models).
Also shows Description, Semantic context, Owners, Audience, Who should use this, and inline Lineage showing the upstream model chain.
Full upstream graph tracing from raw warehouse sources through dbt models to the exposure endpoint.
Exposures have no Run, Test, Metric, or Compiled Code tabs — they are not executed by dbt. All quality and metric signals come from upstream models.
***
## Next Steps
Connect Prizm to dbt Cloud or configure the dbt Core CLI plugin.
Common questions about artifacts, lineage, and troubleshooting.