
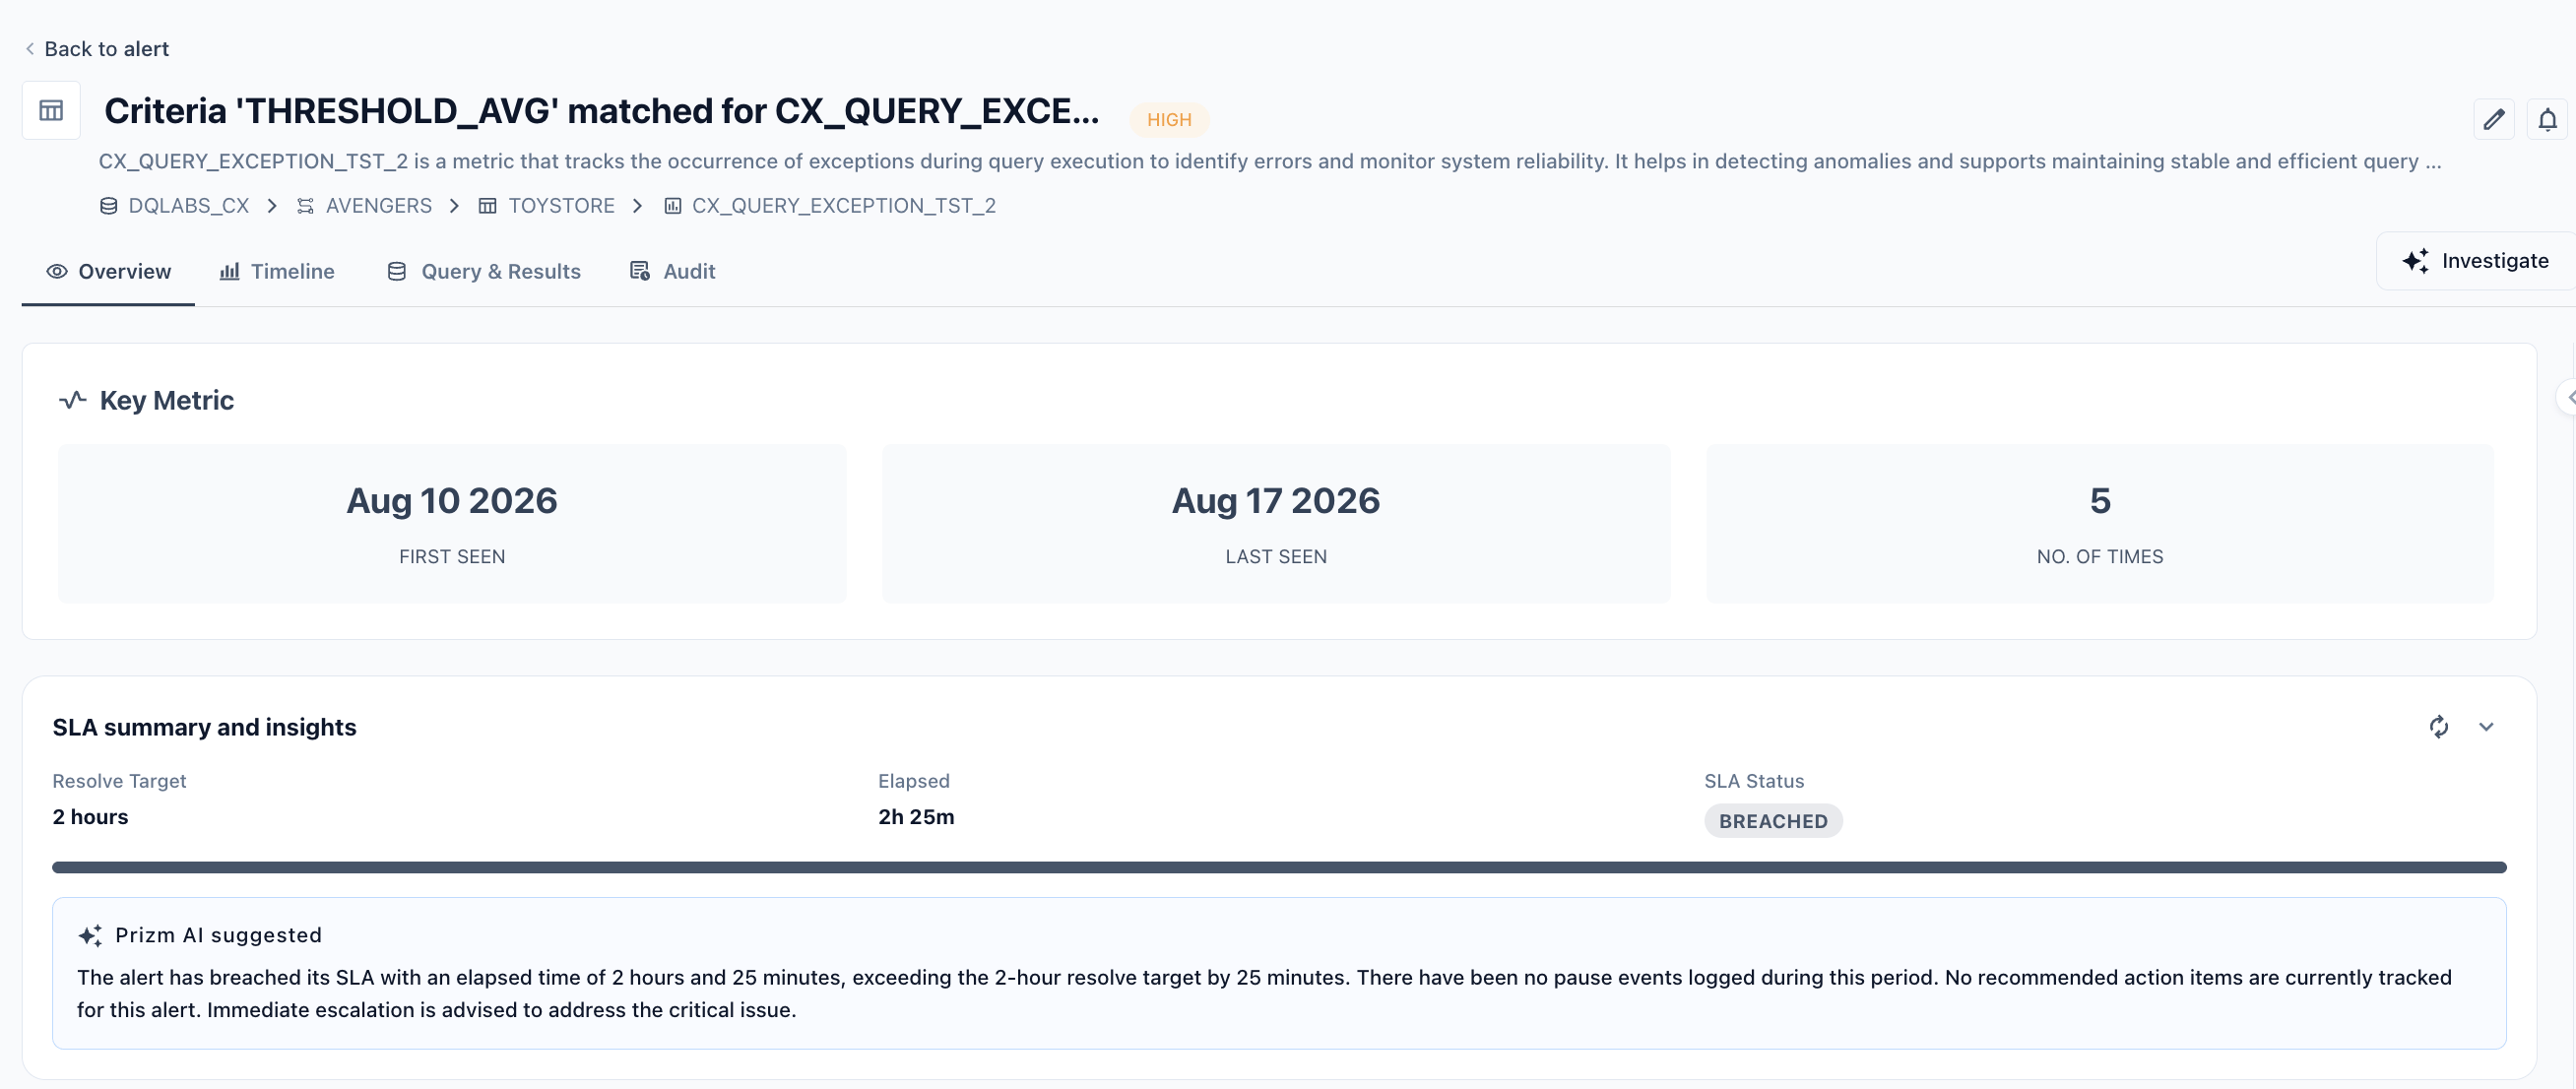
Alert header
- Overview
- Timeline
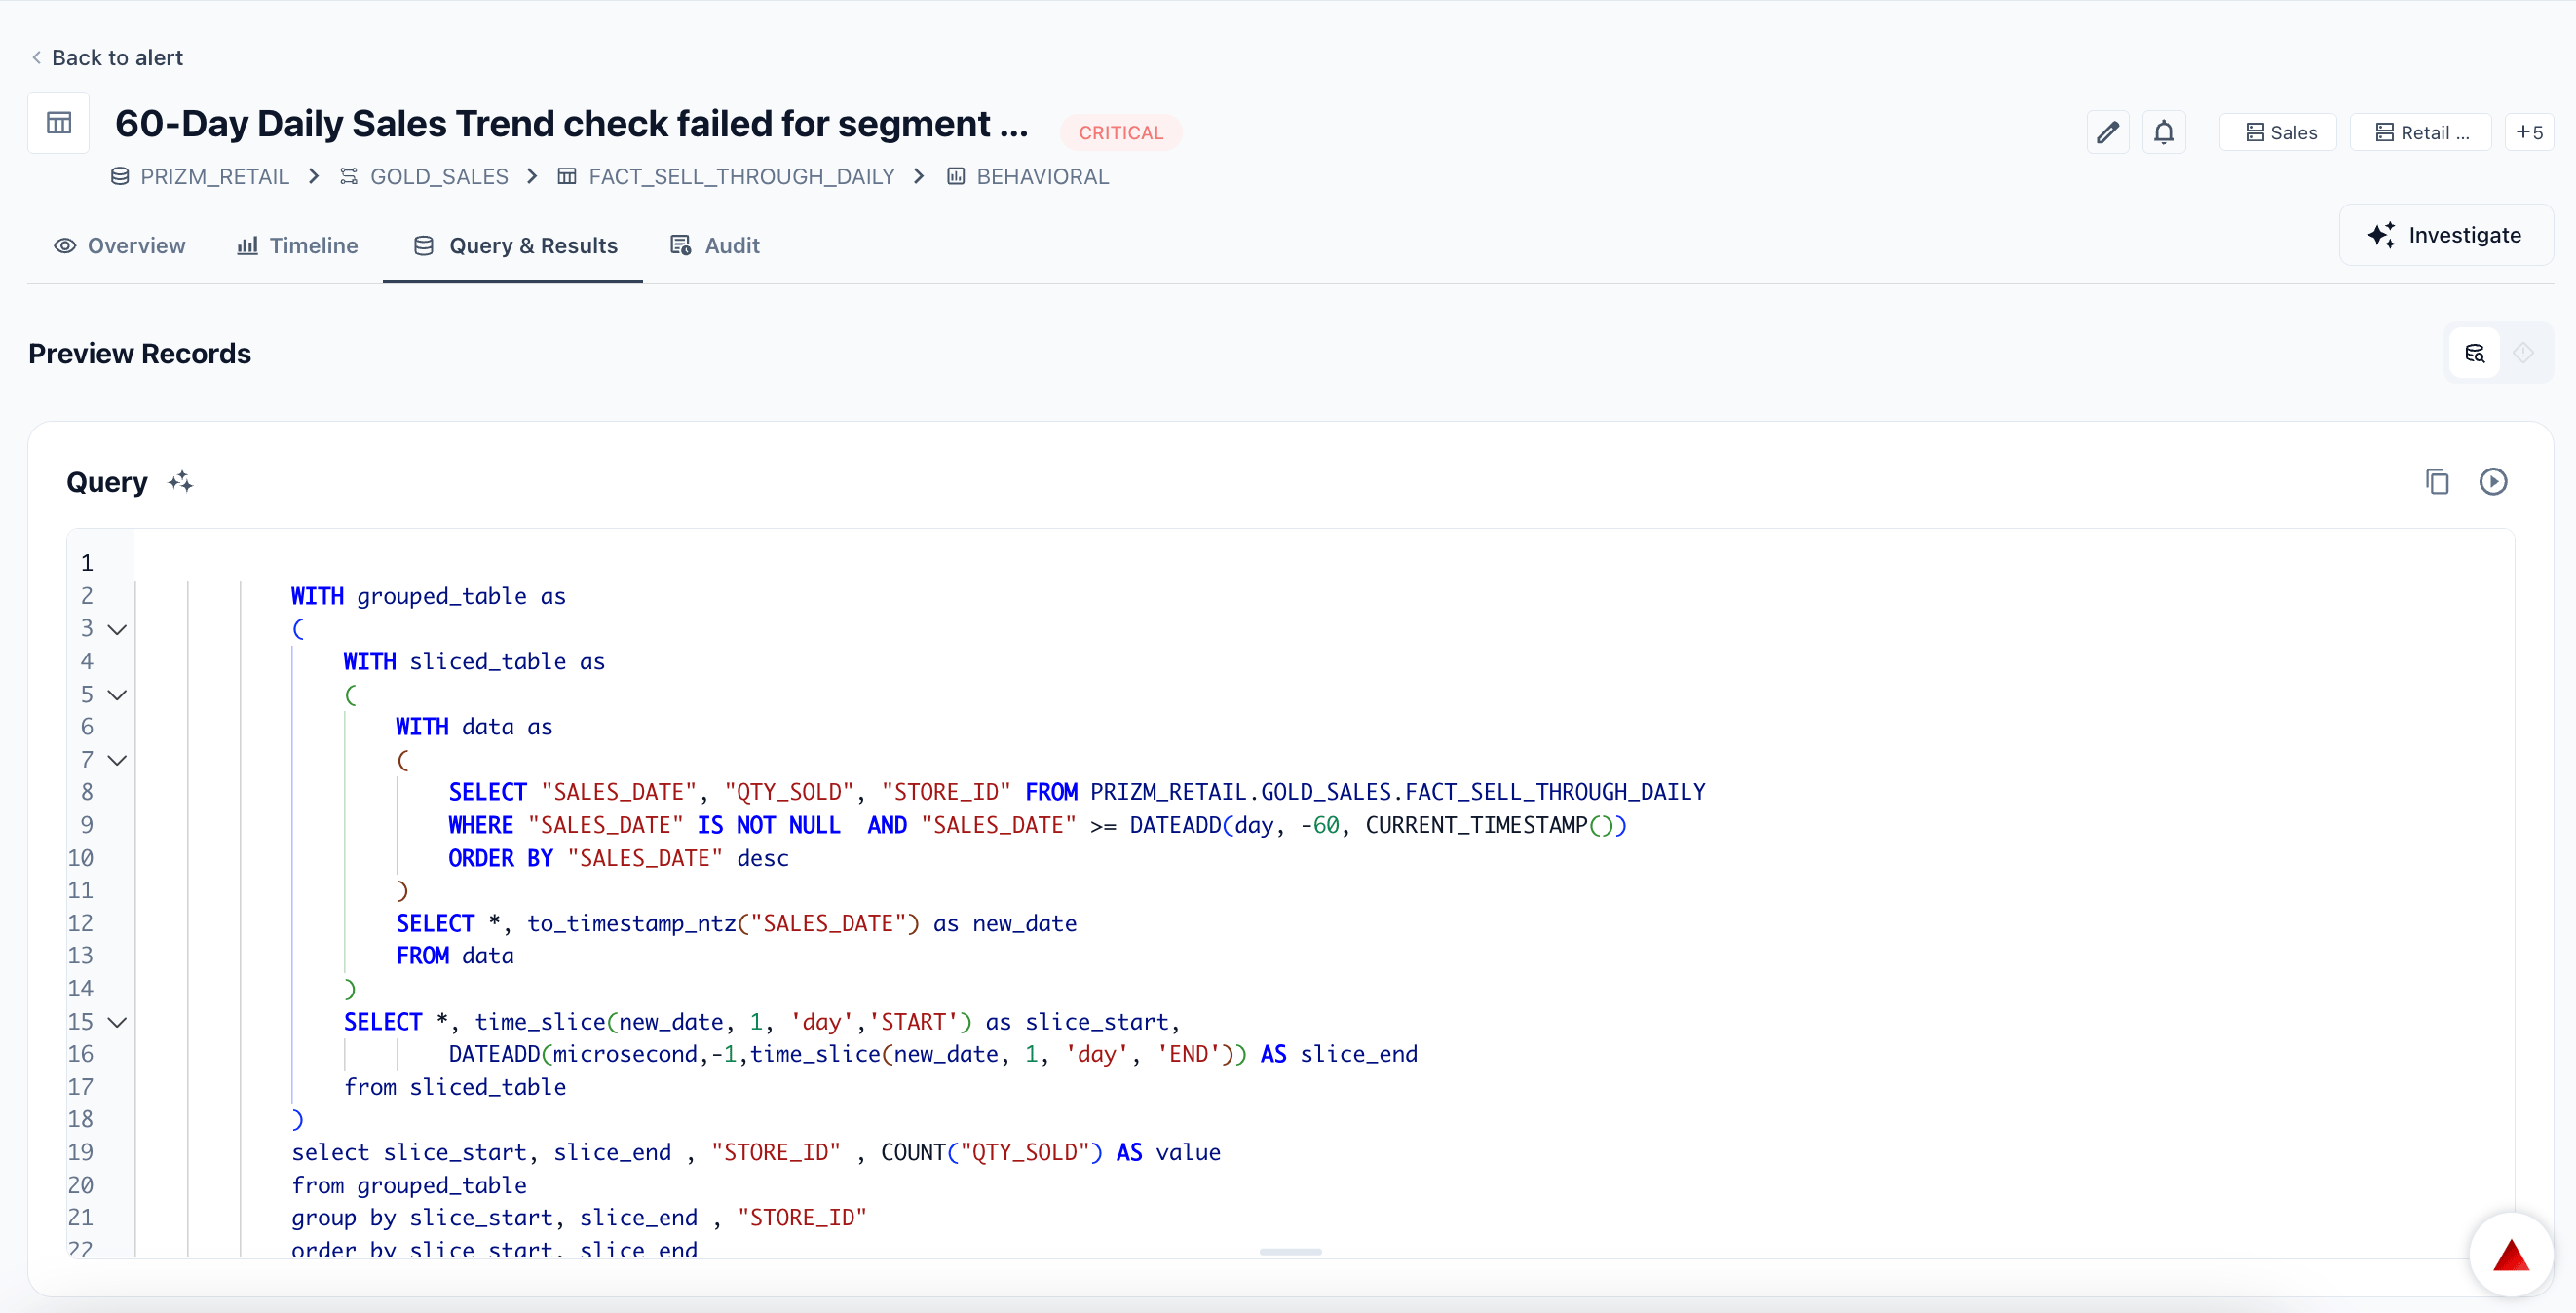
- Query & Results
- Audit
Key metrics
Three quick stats at the top:AI Summary
An AI-generated interpretive paragraph — not a restatement of numbers, but an explanation of what they mean. The summary covers four things in order:- What — the metric, segment, and the observed vs. expected deviation using directional language (spiked, dropped, drifted, exceeded)
- Pattern — the anomaly type in plain English: spike (sharp transient rise), drop (sudden decrease), drift (gradual shift), sustained (persistent, not self-correcting), or shift (step-change to a new level)
- Trend — improving (may be transient), worsening (prioritise immediately), or stable (not self-correcting)
- Recurrence — only shown if the alert has fired more than once; notes how many times since first seen
Alert context
The raw evaluation details behind the alert: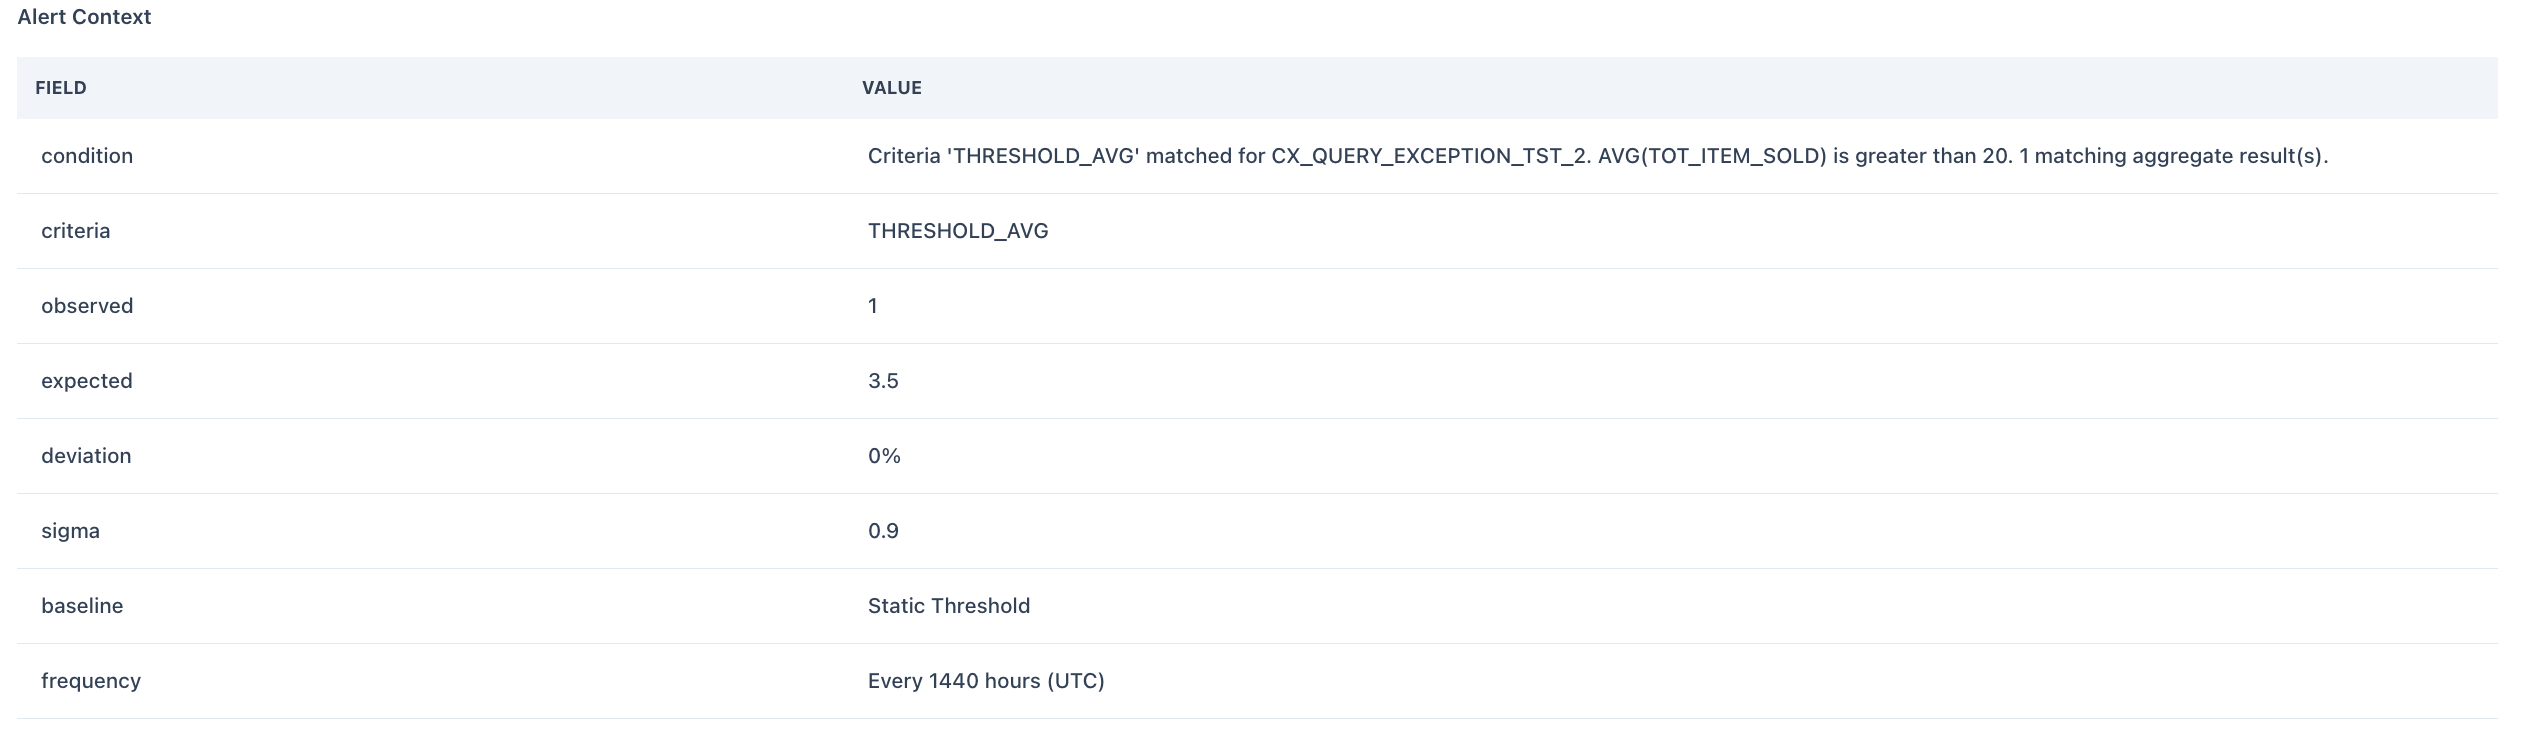
Impact Analysis
Shows downstream assets affected (from lineage), plus an AI Insights paragraph that translates the blast radius into business language:- Groups downstream assets by business domain (sales reporting, inventory management, brand performance, etc.)
- Describes which reports, dashboards, or decisions are at risk
- For Critical and High severity, recommends notifying downstream consumers before they run reports from affected assets
Root Cause Analysis
An AI Insights section with two parts:Context paragraph — what the metric measures, how upstream assets feed it, and why the deviation is meaningful given the baseline model.Three investigation steps — numbered, executable, tied to specific upstream assets or transformation layers:Investigation focus by anomaly type:
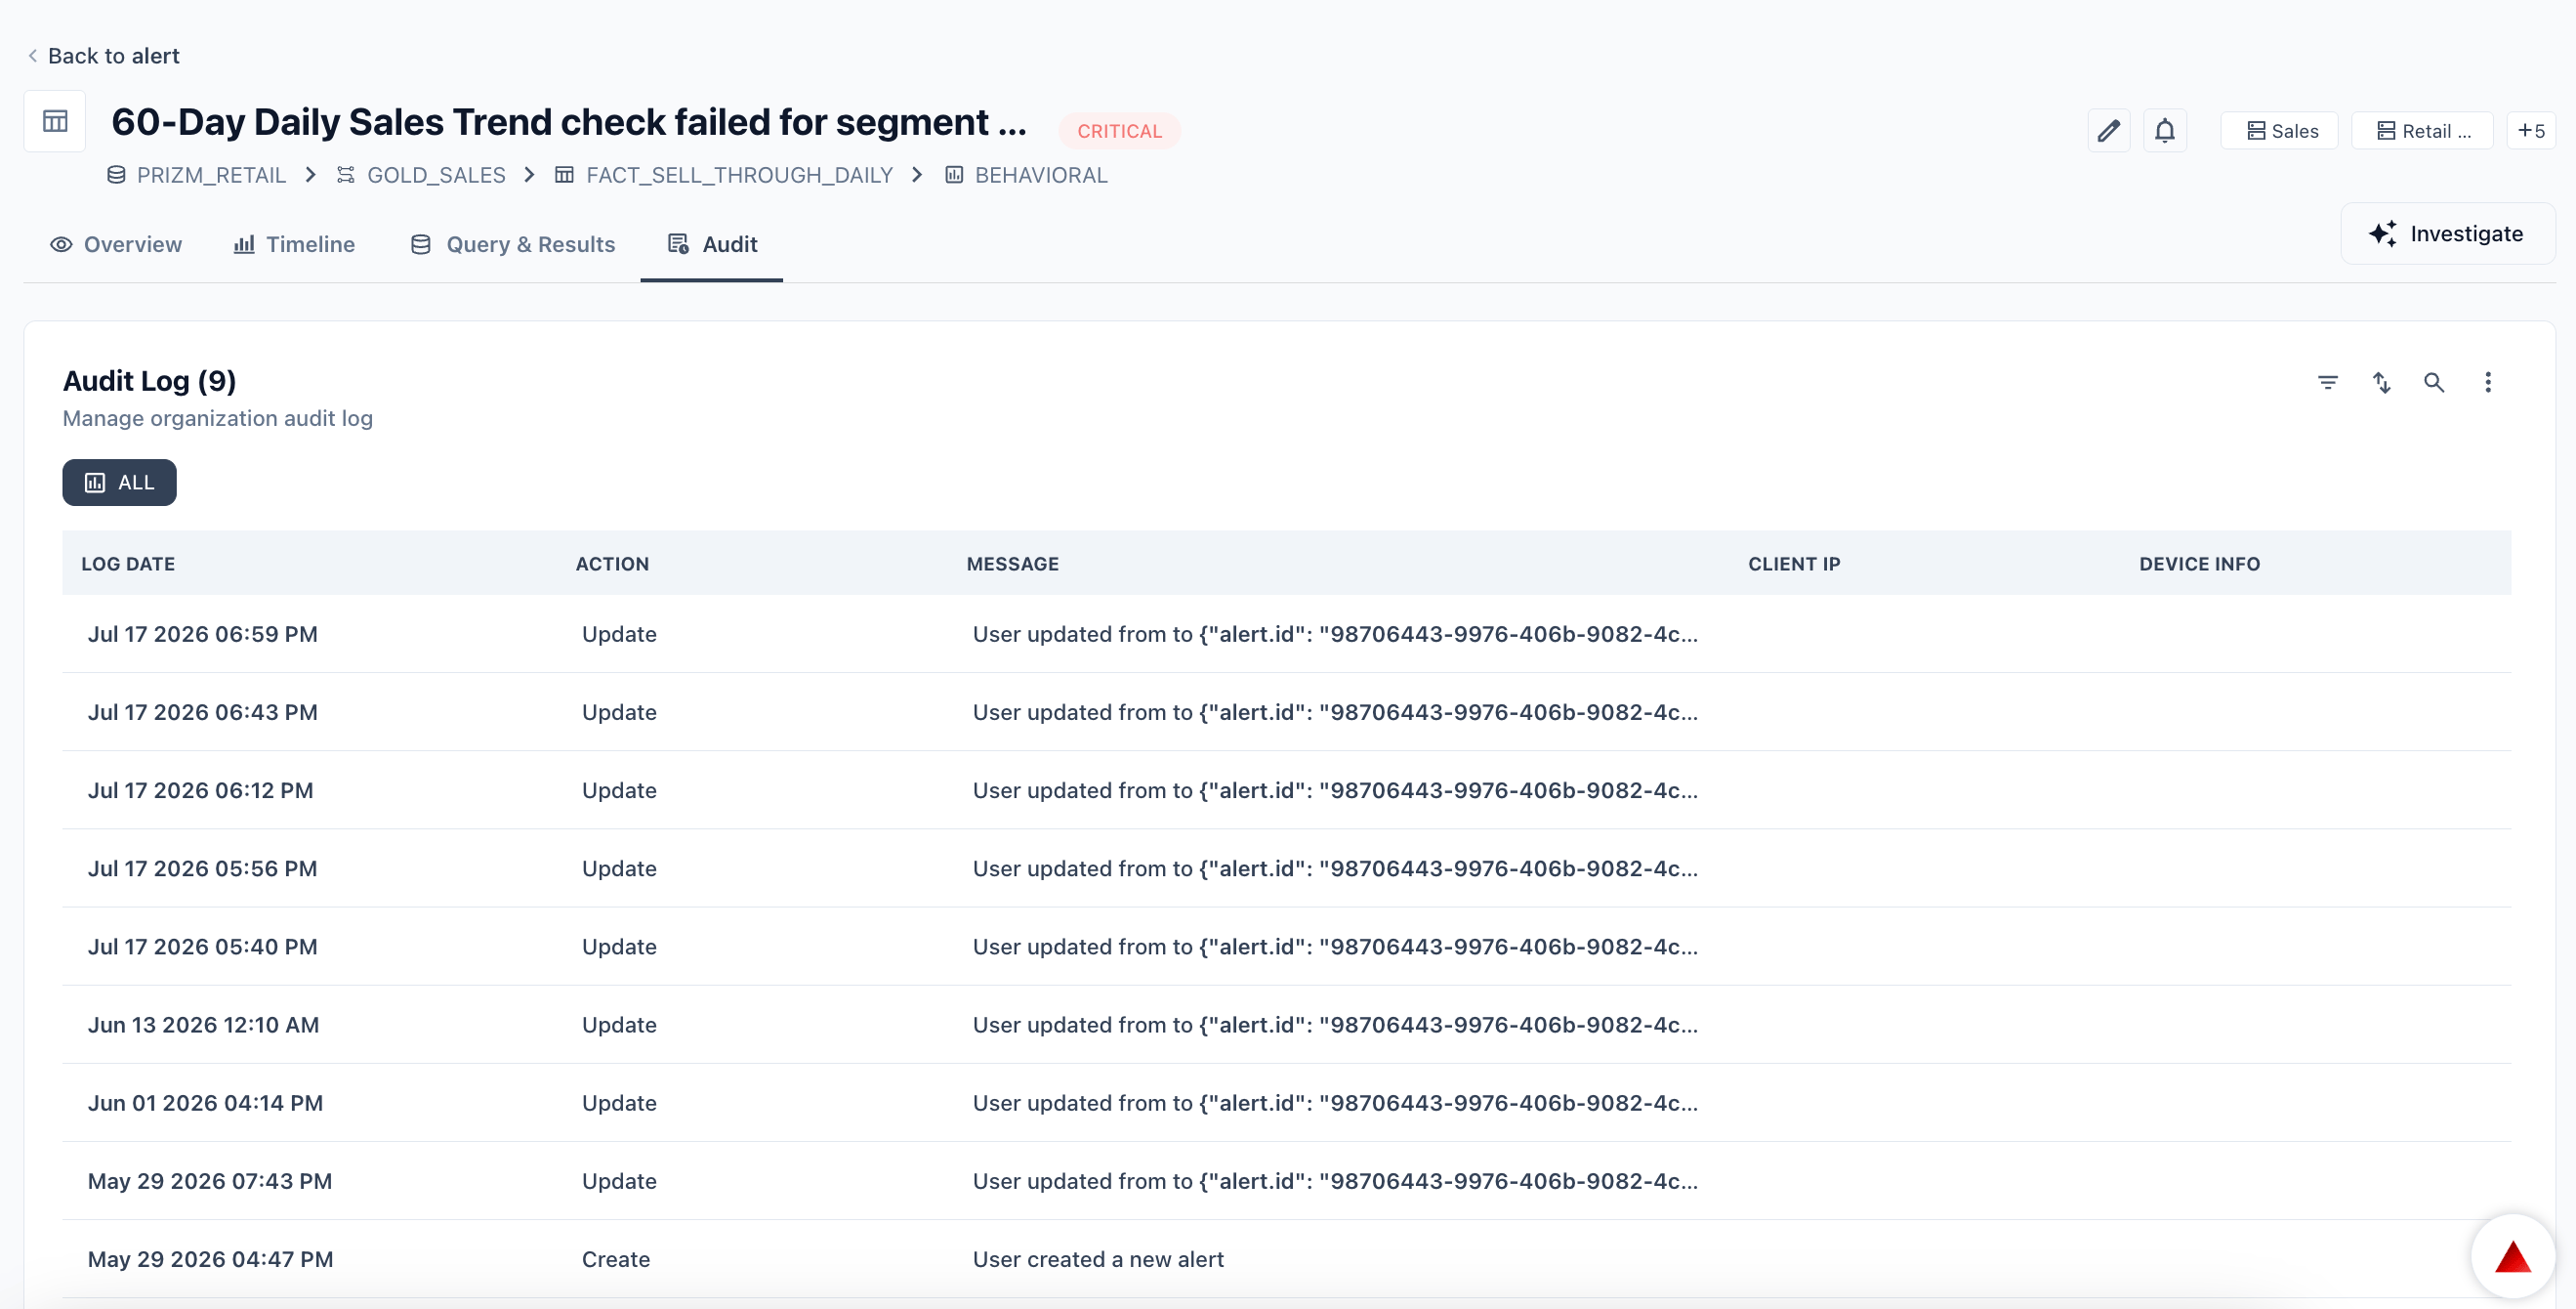
Alert Cluster
If this alert belongs to a cluster (a group of related alerts sharing a common root cause or failure pattern), a cluster summary appears on the detail page: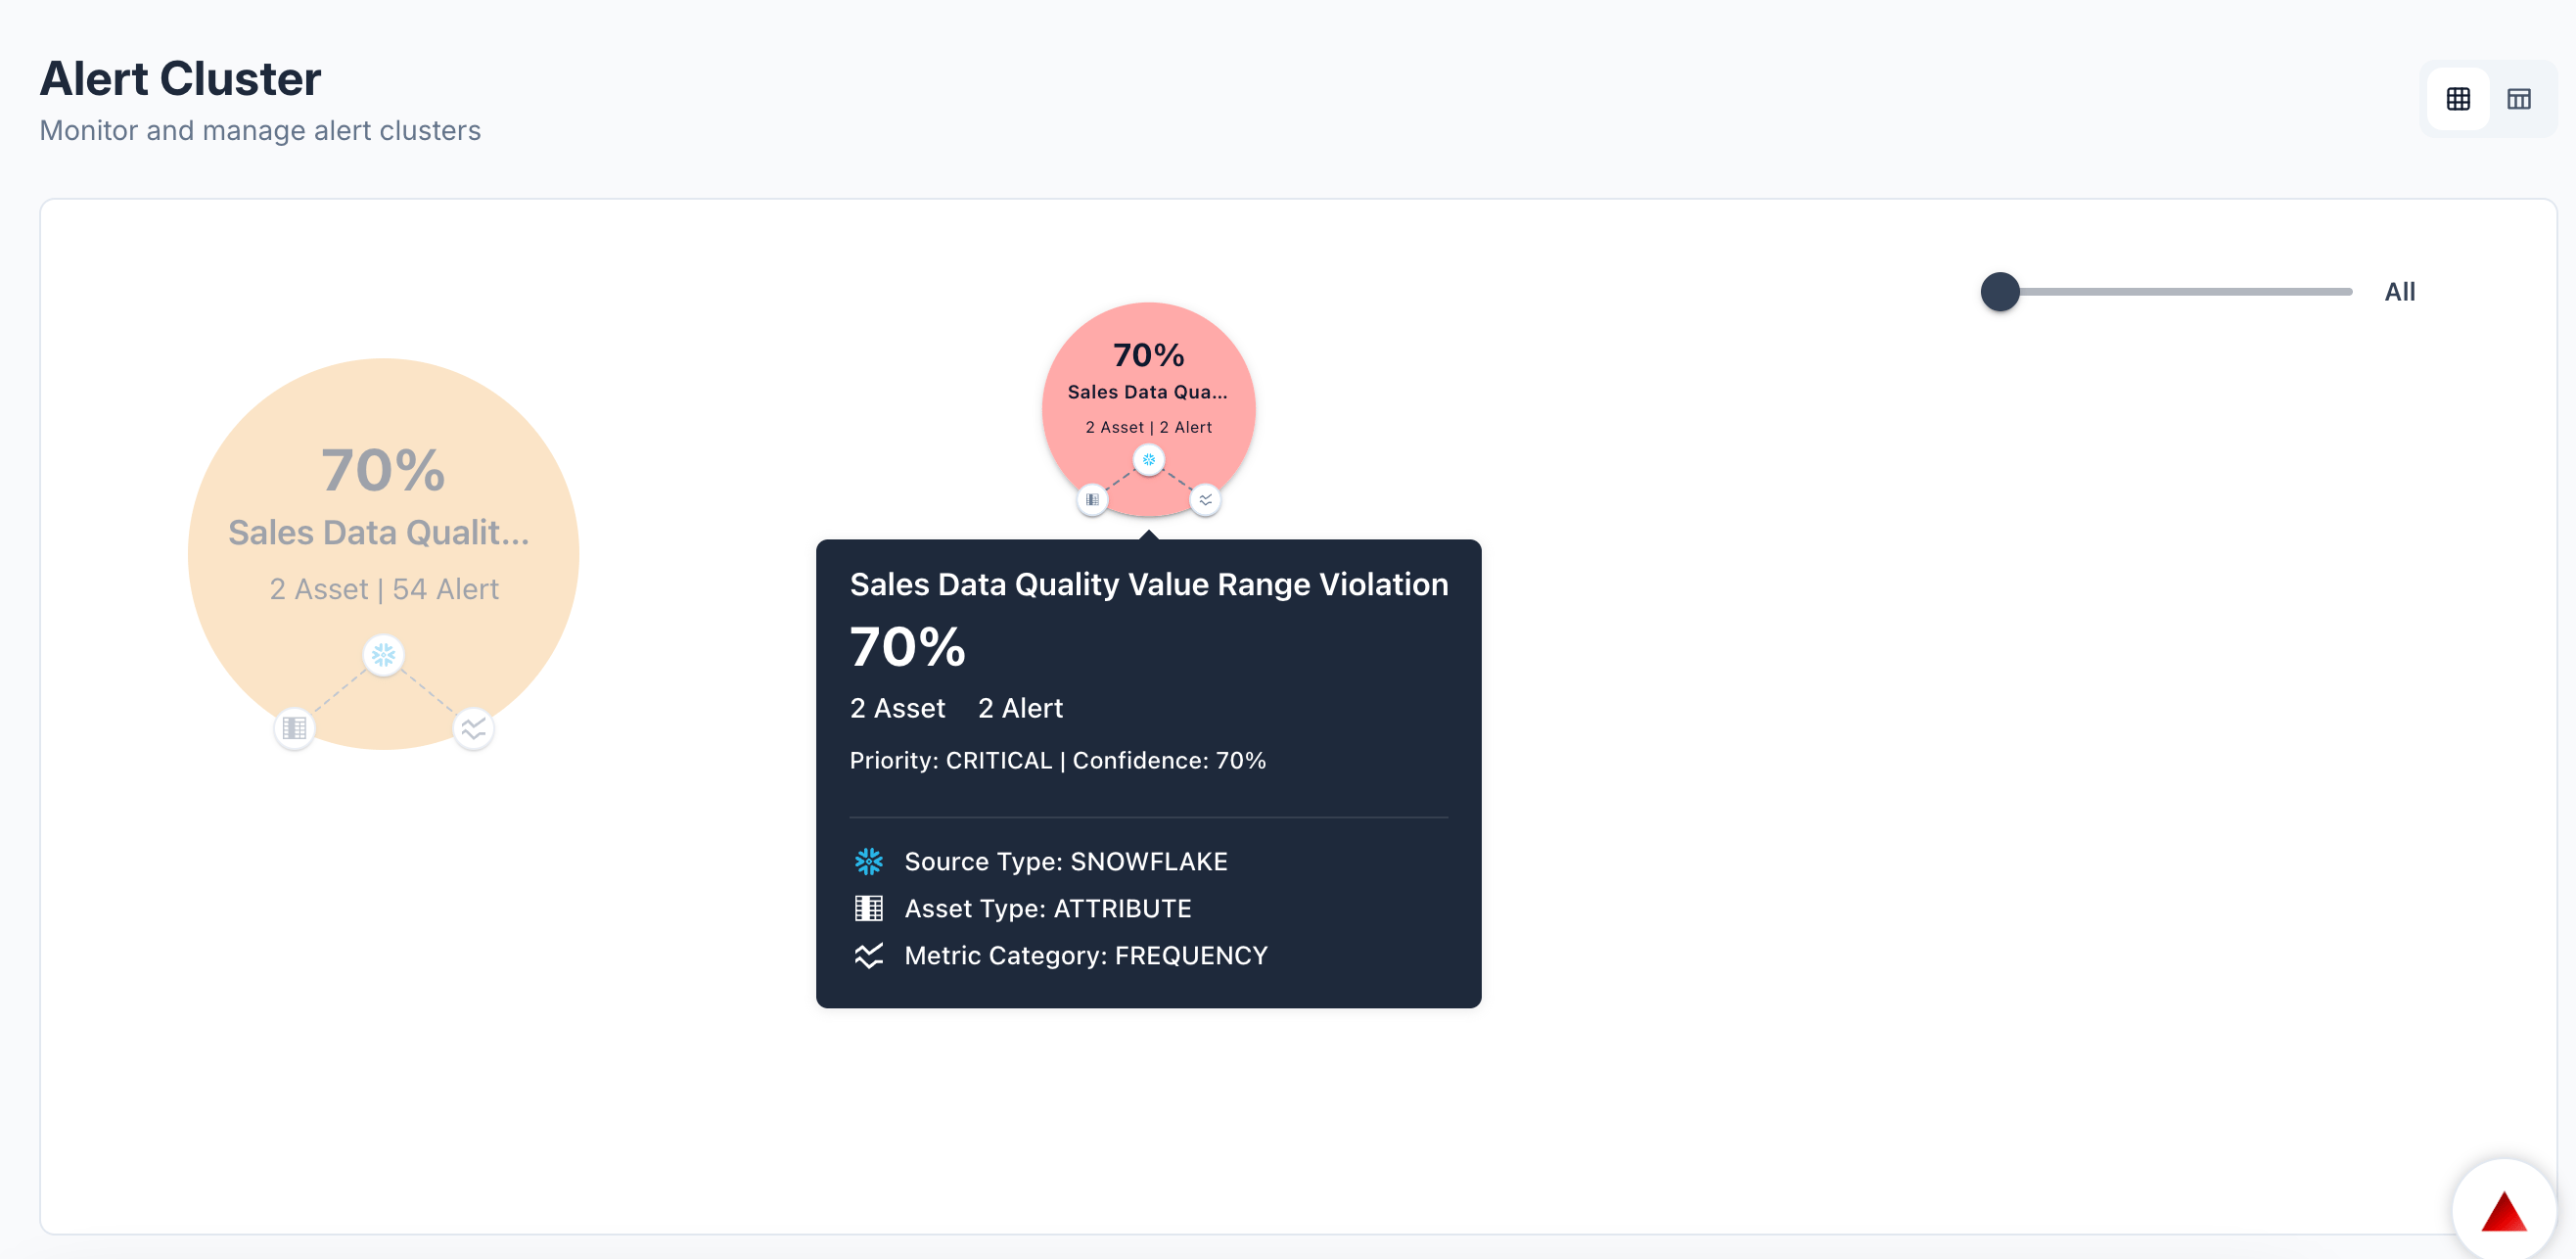
Resolving a cluster does not automatically resolve its member alerts. Each alert must still be individually resolved. The cluster closes when all members are resolved.
Triaging an alert
- Read the AI-generated title and Summary to understand what happened and how serious it is before looking at raw numbers.
- Check the Alert context panel for the exact breach value and threshold.
- Review Impact Analysis to understand downstream exposure and whether consumers need to be notified.
- Follow the Root Cause Analysis steps starting with Step 1 — each step names a specific asset or layer to inspect.
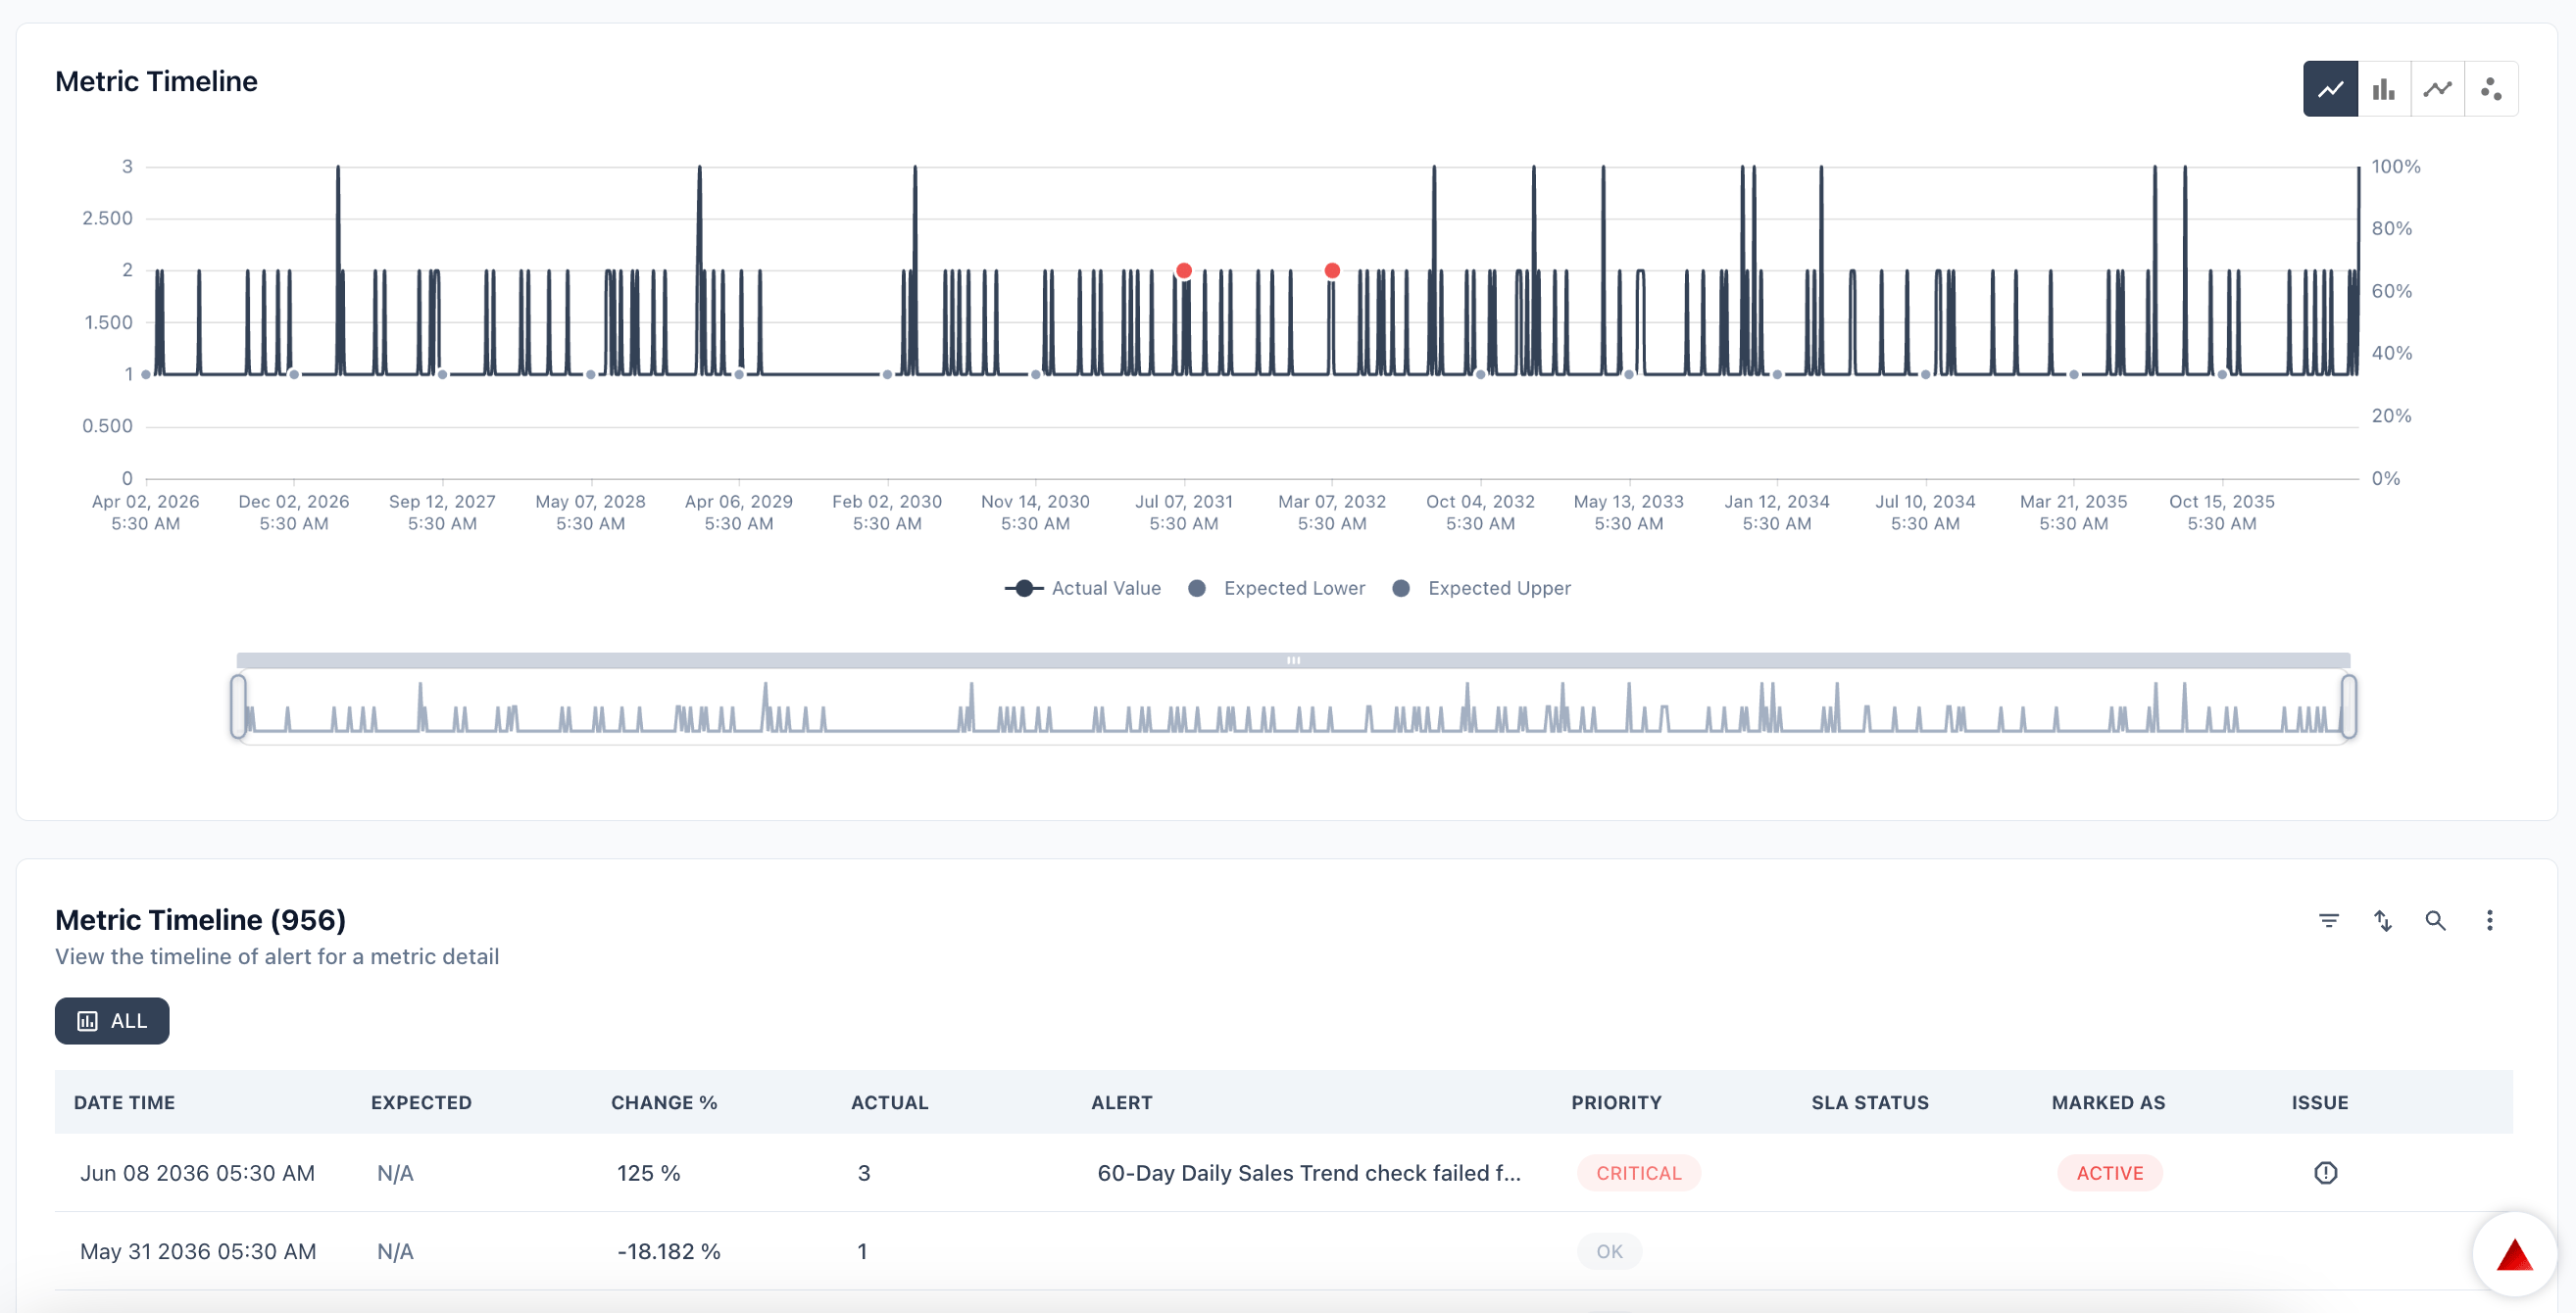
- Check the Timeline tab to determine when the issue started and whether it is recurring.
- Update the Status — mark as normal if no action is needed, or link/create an issue to track remediation. See Alert Management for lifecycle details.
AI Insights quality improves as more context (descriptions, domain tags, lineage) is populated on your assets. Use the Refresh button on any AI module to regenerate from the latest alert state.