
Configuring Distribution metrics
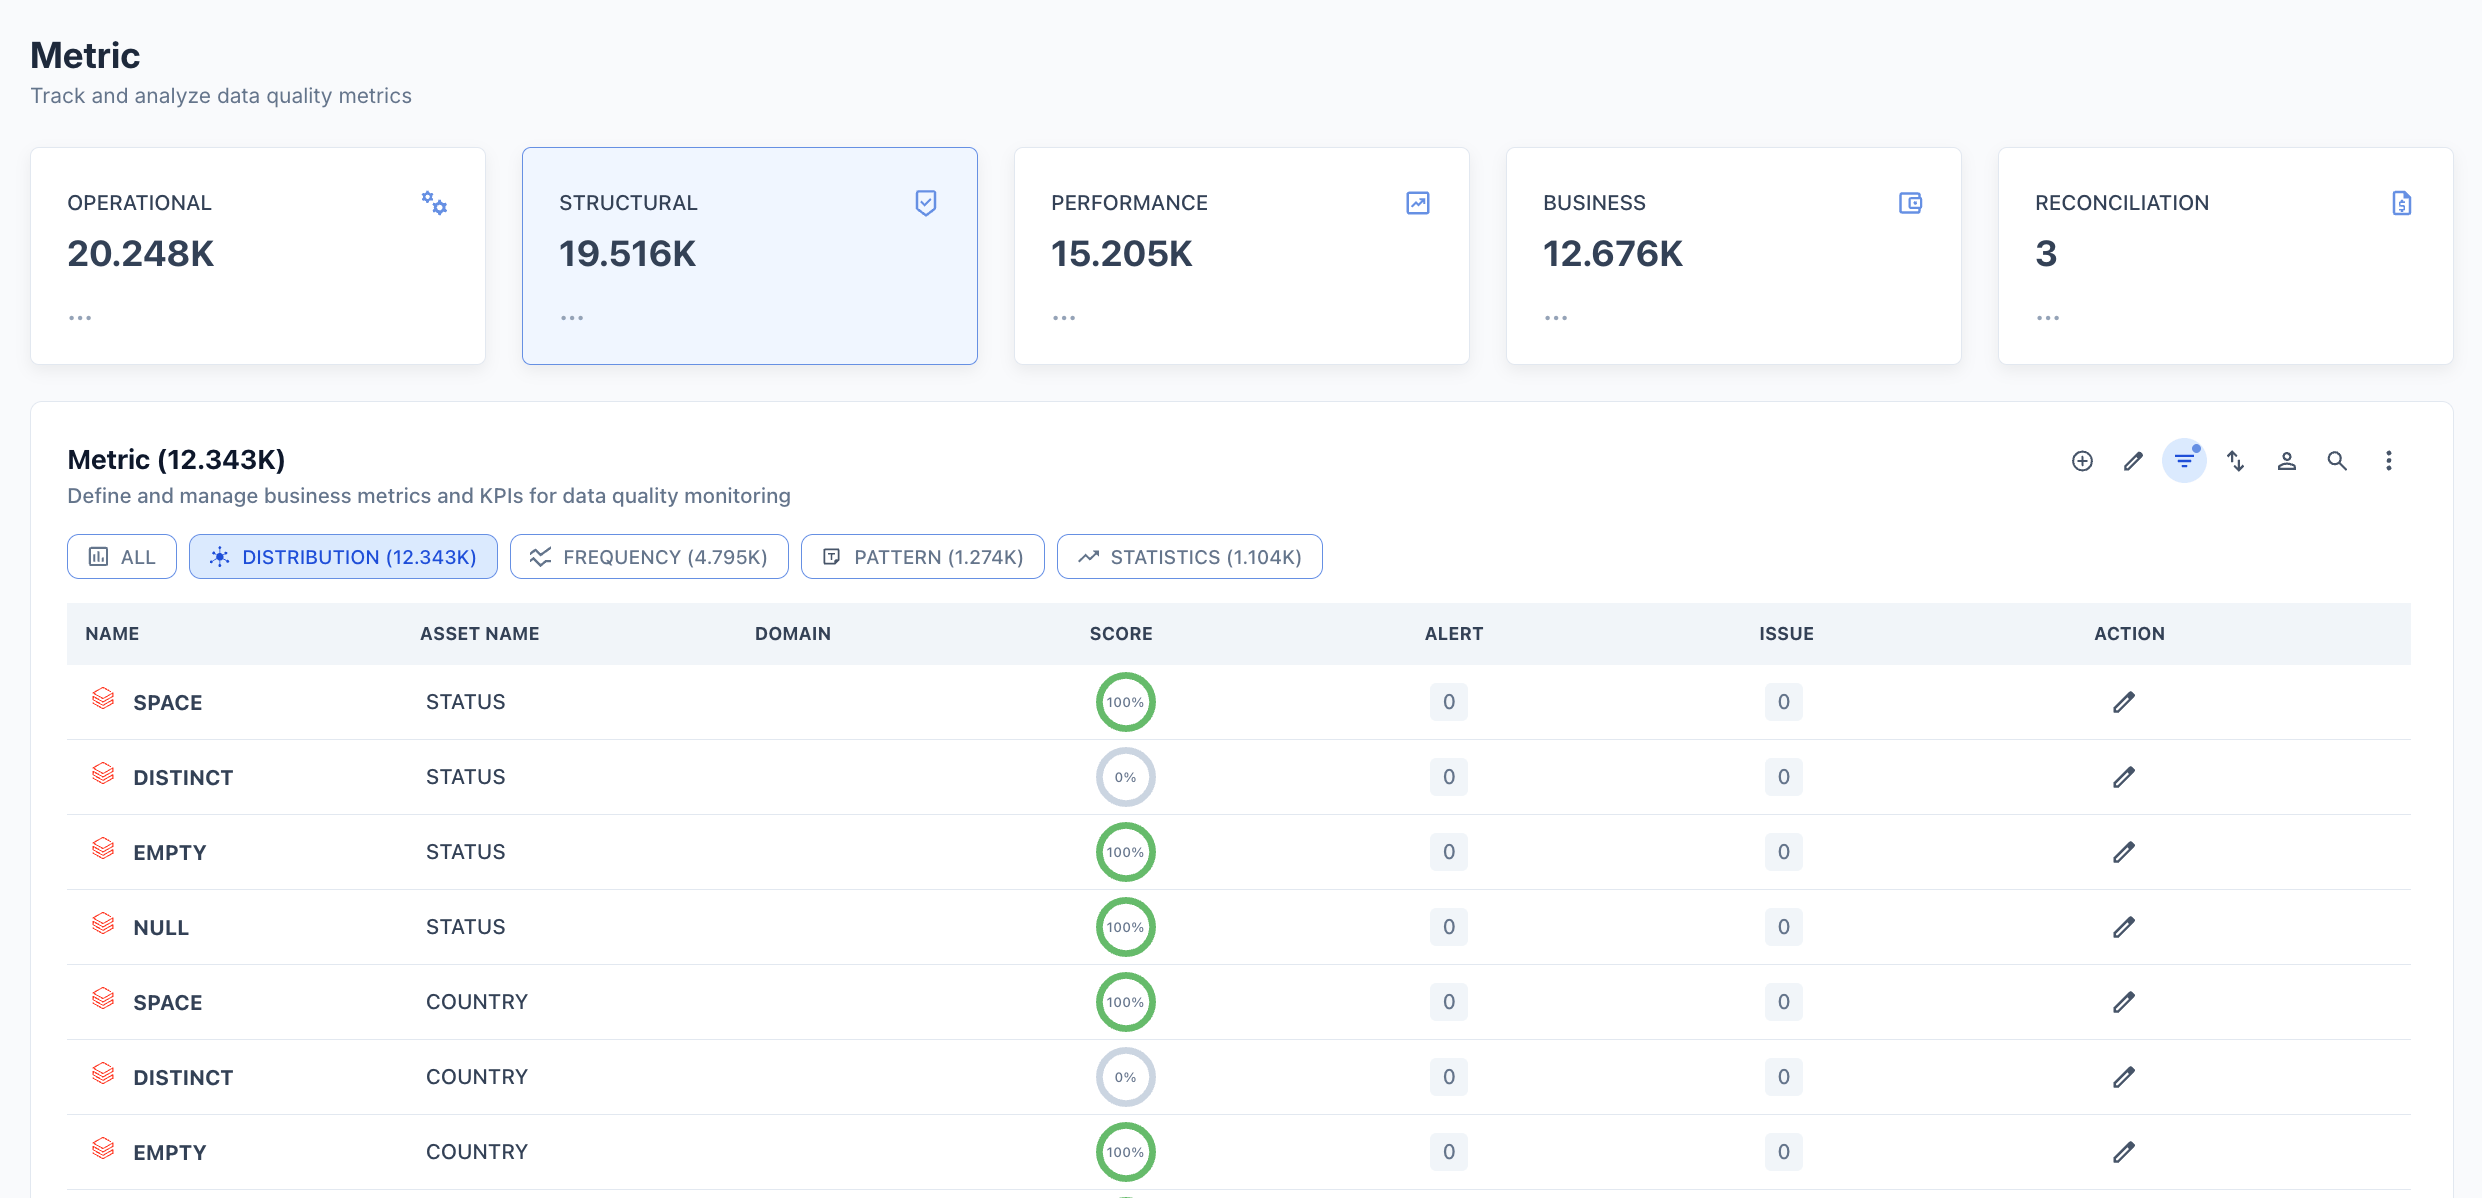
Distribution metrics are enabled per column through the Configure Structural Metrics panel. Once active, thresholds and settings are managed on the asset’s Metric tab.- Navigate to Metric in the top navigation.
- Click Configure Structural Metrics (the waveform icon in the toolbar).
- In the Map Asset/Attributes to the Metrics search field, select the target asset and column.
- Click the Distribution tab and check the specific metrics to enable (or Select All Distribution Metrics).
- Click Apply.
Configuration options
Threshold
Choose how Prizm determines when to raise a Distribution alert. Automated Threshold — System-generated thresholds based on the historical baseline for each distribution metric. Prizm computes how many standard deviations the current value is from the baseline and maps deviation magnitude to alert priority:
Custom Threshold — User-defined absolute limits for triggering alerts. Particularly useful for null-based metrics where a hard ceiling is required regardless of historical baseline — for example, alert if Null Percentage exceeds 5% or if Null count exceeds 0 on a required column.
Semantic context
Distribution metrics are automatically tagged with:- Dimension: Completeness
- Domain: Inherited from the asset’s domain assignment