
Configuring Statistics metrics
Statistics metrics are enabled per column through the Configure Structural Metrics panel. Once active, thresholds and settings are managed on the asset’s Metric tab.- Navigate to Metric in the top navigation.
- Click Configure Structural Metrics (the waveform icon in the toolbar).
- In the Map Asset/Attributes to the Metrics search field, select the target asset and column.
- Click the Statistics tab and check the specific statistics to enable (or Select All Statistics Metrics).
- Click Apply.
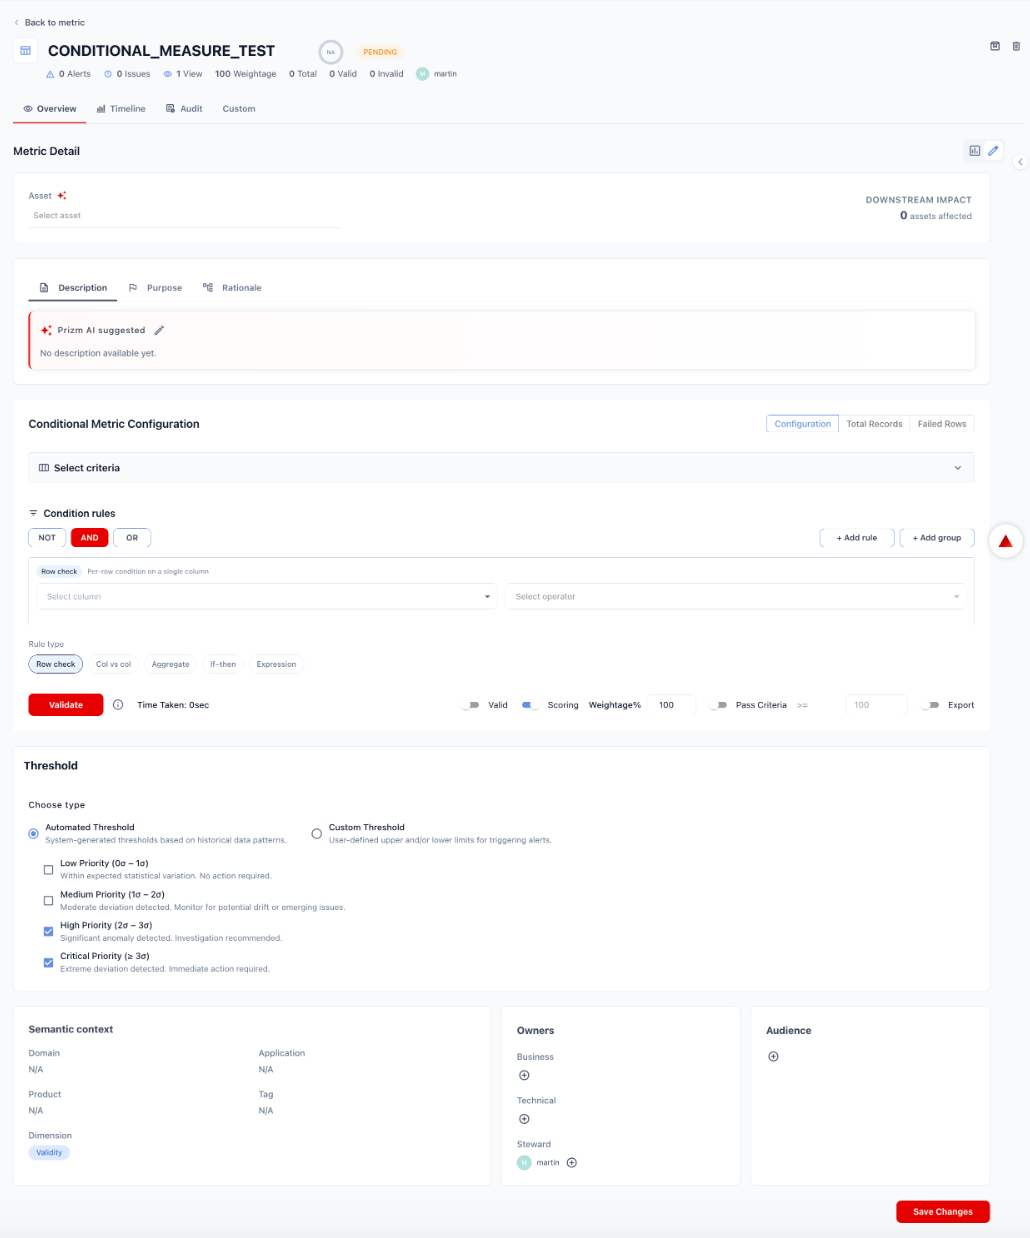
Configuration options
Threshold
Choose how Prizm determines when to raise a Statistics alert. Automated Threshold — System-generated thresholds based on the historical baseline for each statistic. Prizm computes how many standard deviations the current value is from the baseline and maps deviation magnitude to alert priority:
Custom Threshold — User-defined absolute limits for triggering alerts. Useful for financial columns with known valid ranges — for example, alert if Mean transaction amount exceeds $10,000 or if Sum deviates by more than ±5% from the expected daily total.
Semantic context
Statistics metrics are automatically tagged with:- Dimension: Reliability
- Domain: Inherited from the asset’s domain assignment