
Configuring a Volume metric
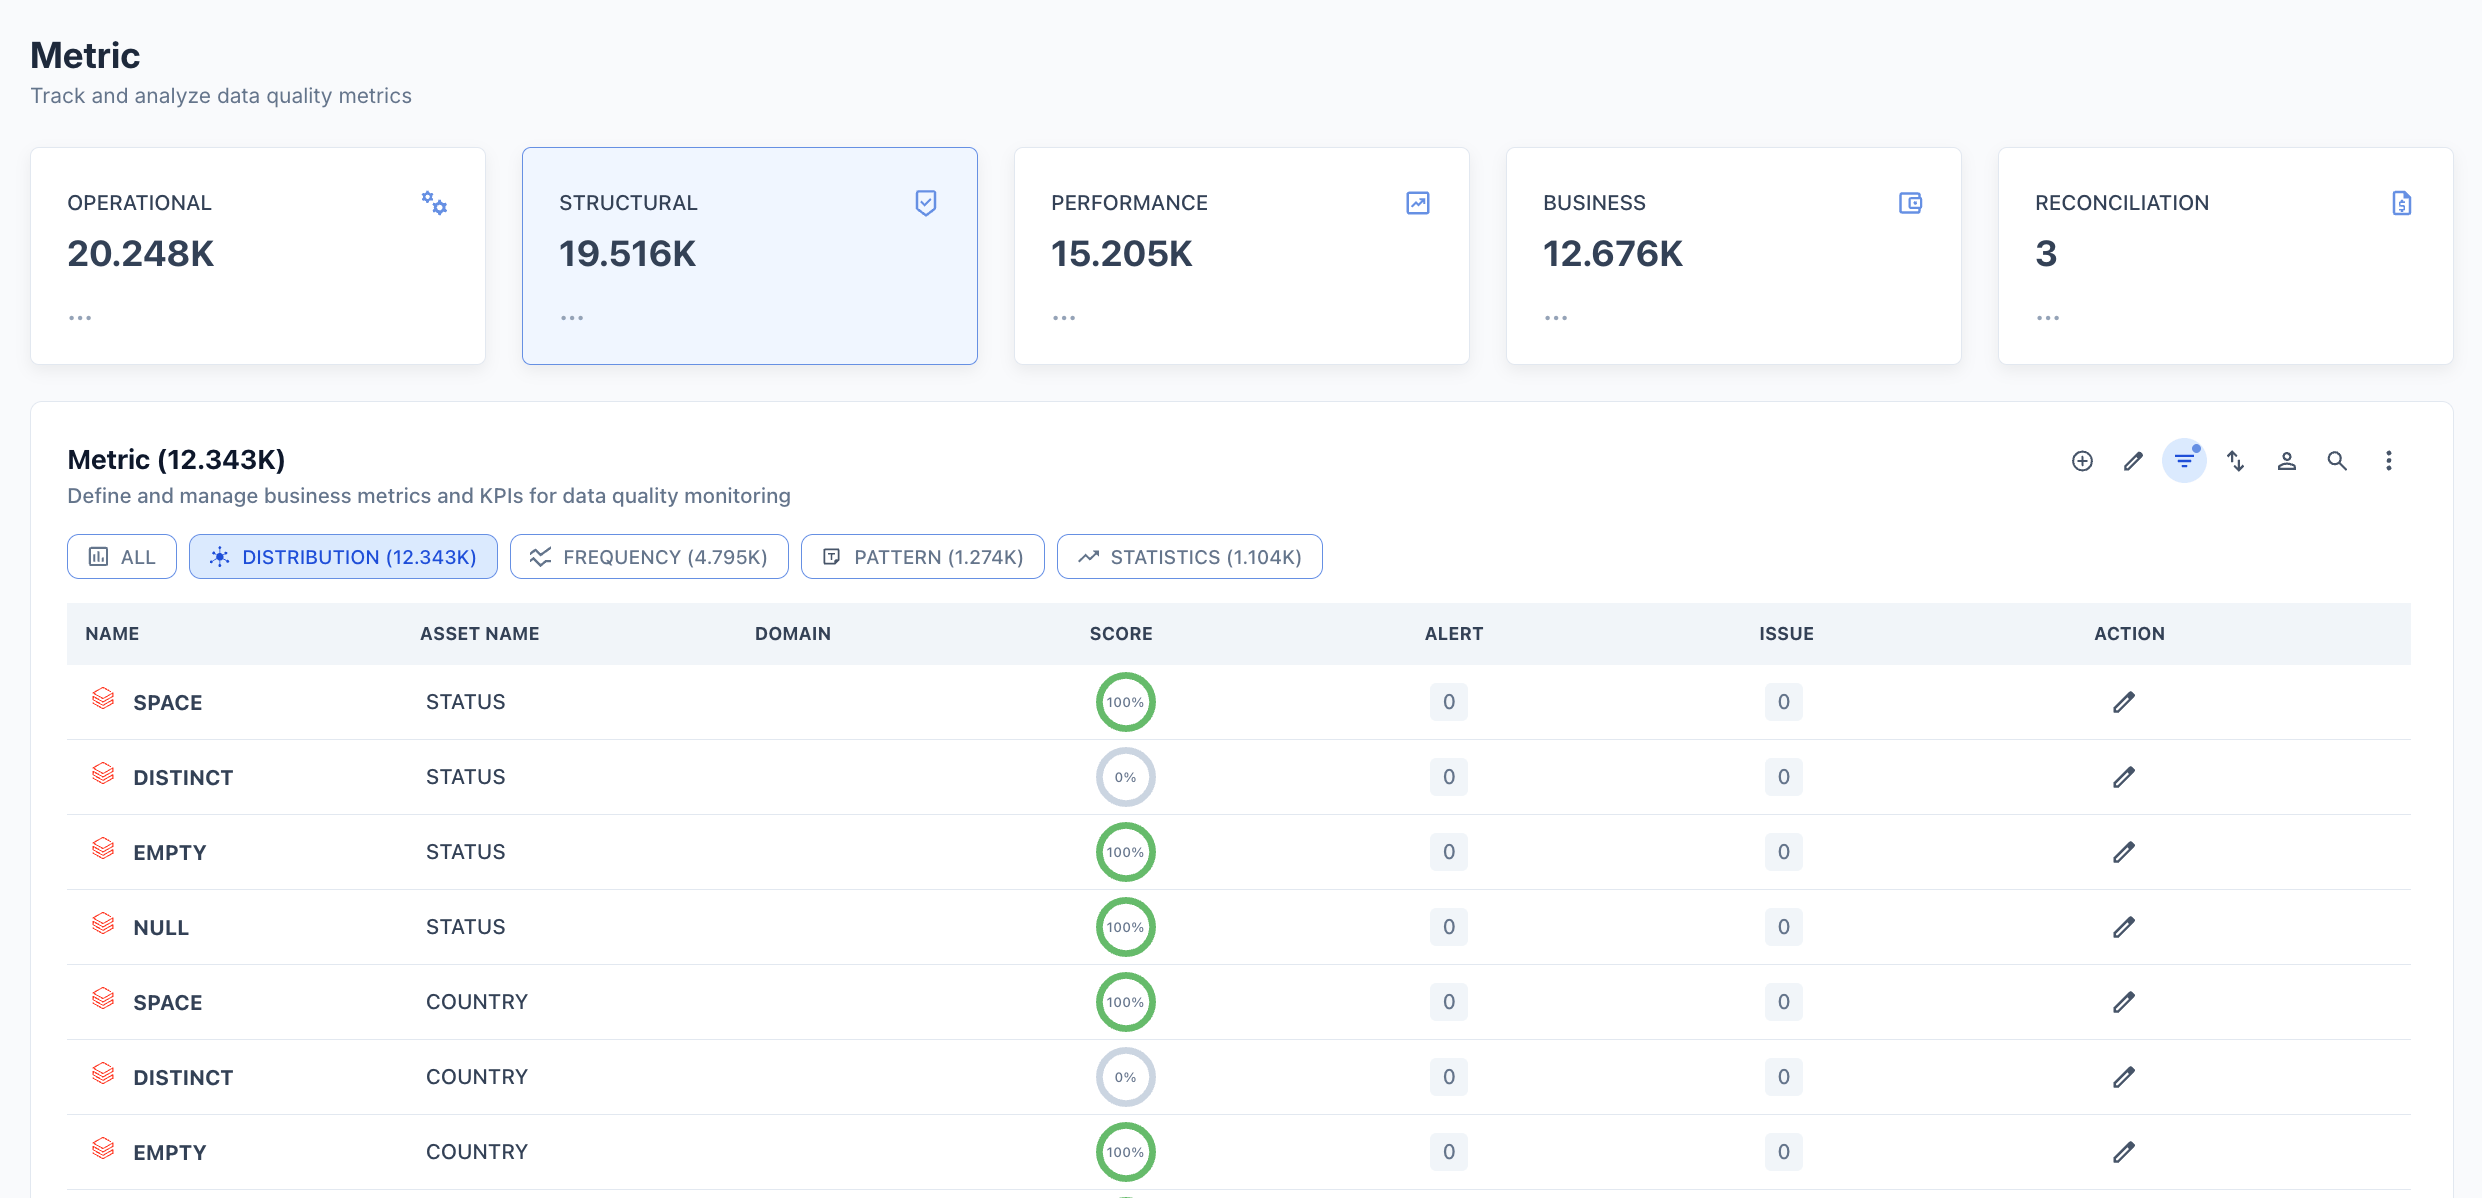
Volume metrics are automatically active on every connected asset. Configuration is optional — the defaults cover most use cases. To view or configure a Volume metric:- Navigate to Asset and open the asset page.
- Click the Metric tab.
- Select the AVAILABILITY filter chip.
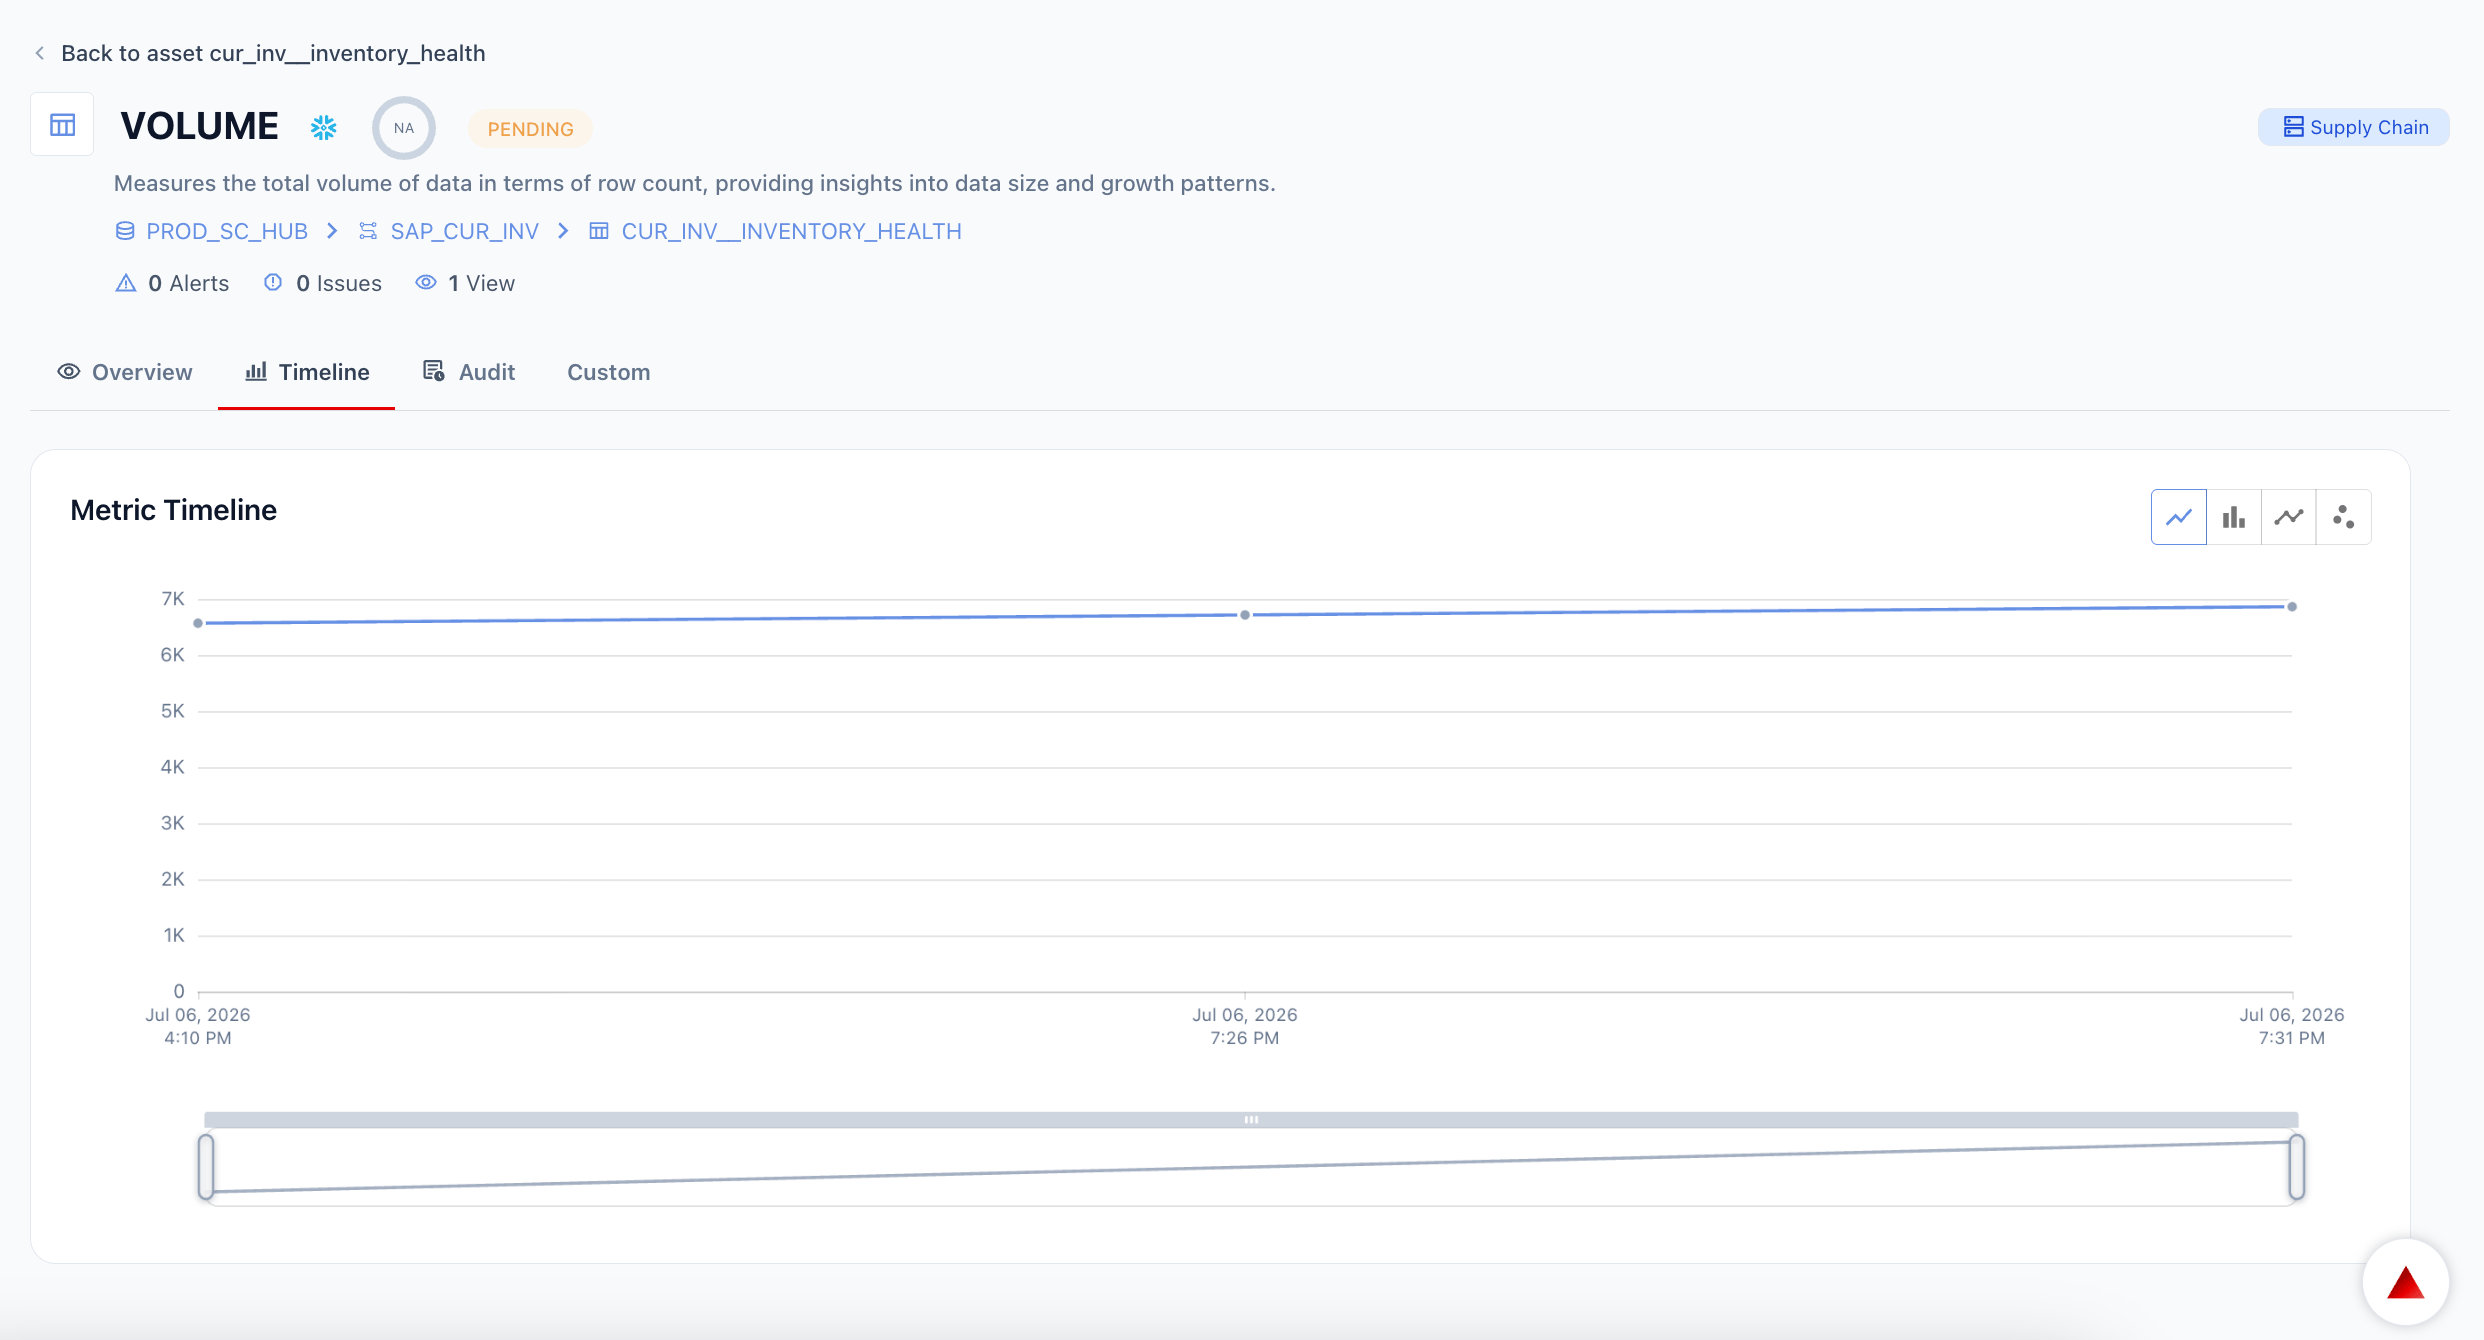
- Click VOLUME in the list to open its detail page.
- Click the Edit configuration icon (pencil) to open the configuration panel.
Configuration options
Threshold
Choose how Prizm determines when to raise a Volume alert. Automated Threshold — System-generated thresholds based on historical data patterns. Prizm computes the statistical baseline from past run values and maps deviation magnitude to alert priority:
The threshold description shows the actual row-count range Prizm is currently using — for example, “currently between 7.5M – 7.5M rows” — based on observed historical values.
Custom Threshold — User-defined upper and/or lower limits for triggering alerts. Use when you need a hard floor on row count (e.g., alert if row count drops below 10,000) regardless of historical baseline.
Semantic context
Volume metrics are automatically tagged with:- Dimension: Completeness
- Domain: Inherited from the asset’s domain assignment