
How exceptions are generated
Exception writing must be enabled on each metric. When it is enabled, every failed metric run also executes a Failed Rows Query, a companion SQL query that returns the individual records contributing to the failure. Each returned row becomes an exception record.Prerequisites
Check the following before you expect exception records to appear.Use a supported storage provider
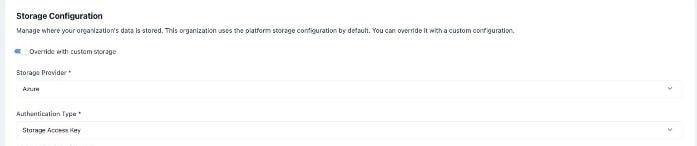
Storage provider in Organization → Platform → Storage
Turn on Write Exception under Remediation
Define the schema under Remediation
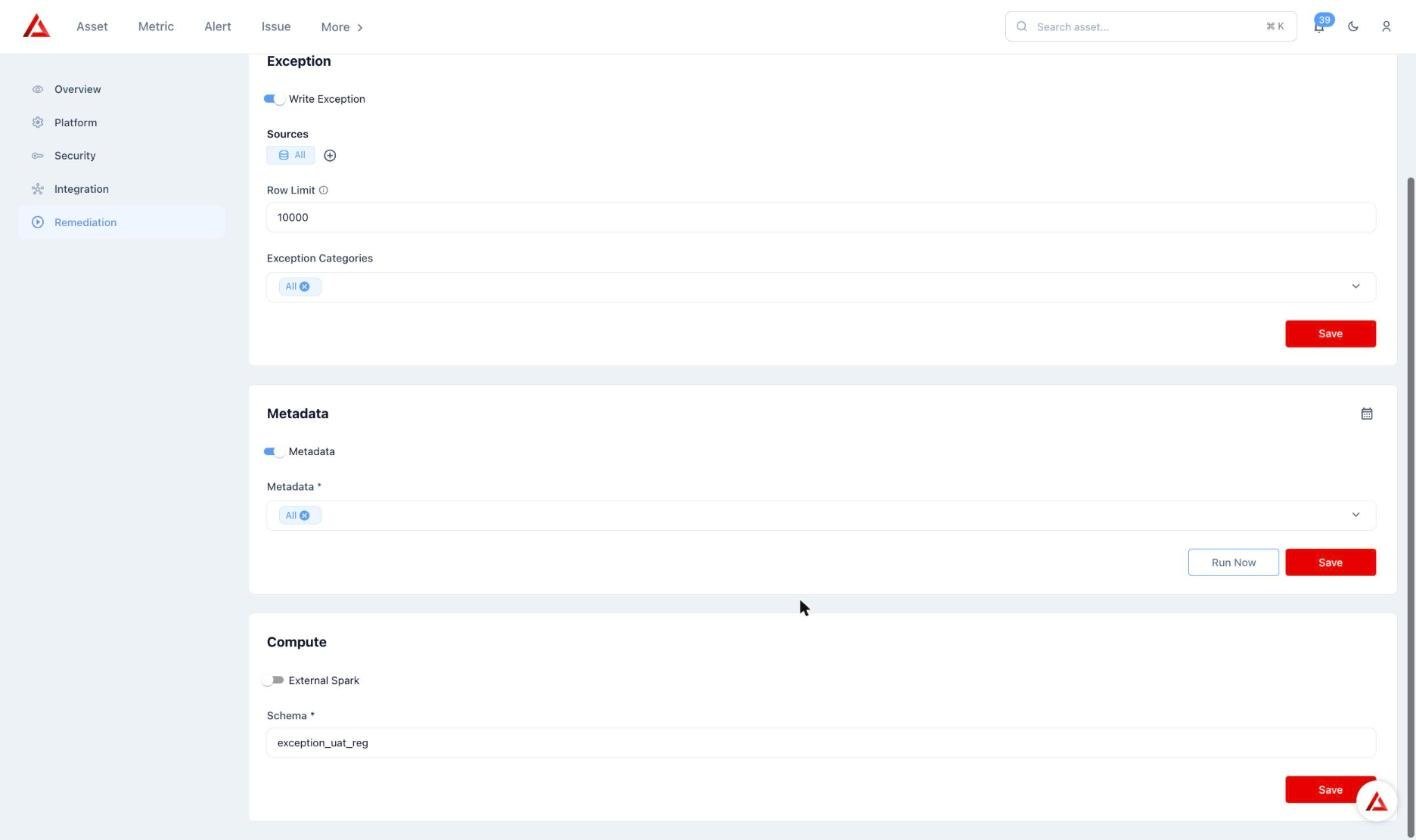
Write Exception and Compute schema in Organization → Remediation
Set up the Spark configuration
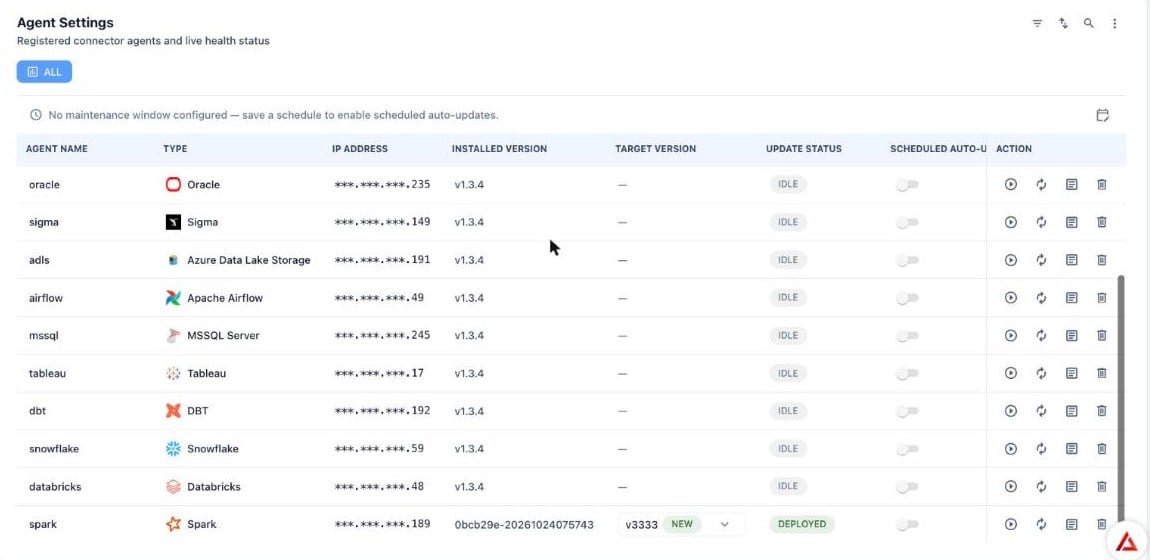
Spark agent in Agent Settings
Use verified metrics with scoring enabled

A verified metric with Export on in the Metric list
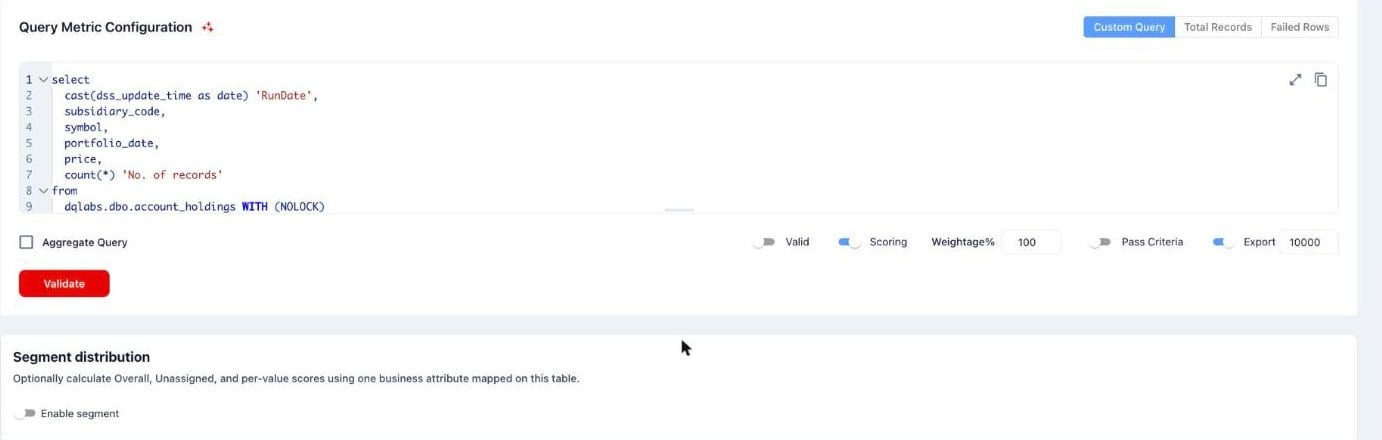
Scoring and Export in Query Metric Configuration
Have an alert and invalid records
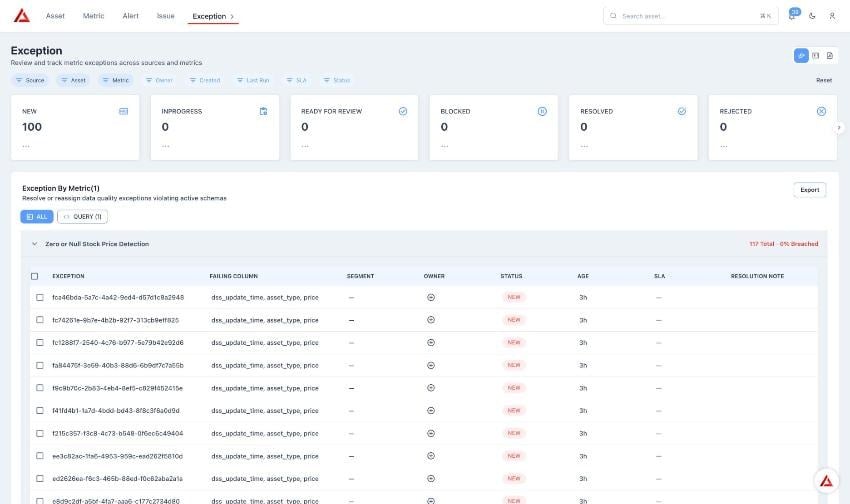
Exception by Metric view with records grouped under the metric
Where to find exceptions
Open the Exception tab in Prizm. The view switcher at the top right of the page has three views.Exception record statuses
SLA status
Each exception record carries an SLA Status that tracks whether remediation is on time based on the metric’s configured SLA window. The SLA clock starts when the record is first created and freezes when the record is resolved or closed.Enabling exception writing
Exception records are only created when Write Exception is turned on both in Organization → Remediation and for the metric. At the metric level, the setting appears as the Export toggle, with a row limit, in Query Metric Configuration.Open the metric configuration
Enable Write Exception
Add a Failed Rows Query
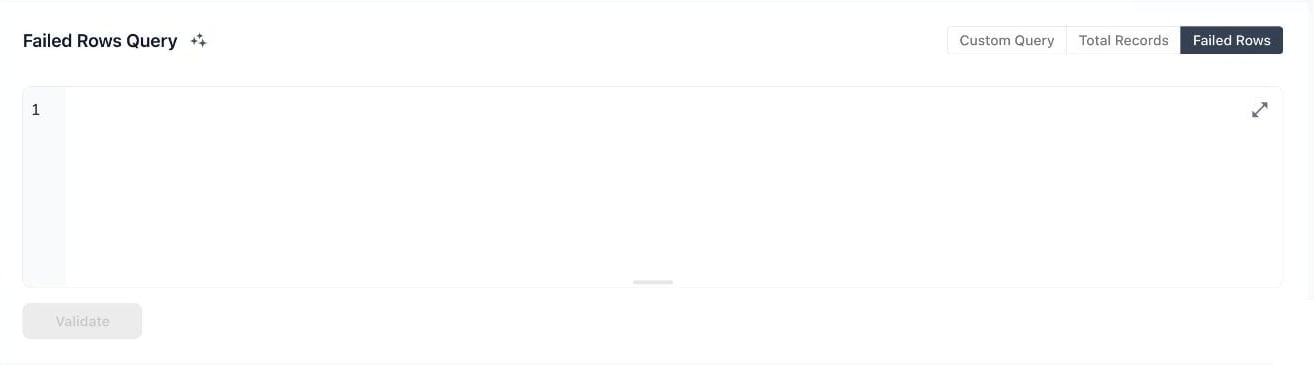
Failed Rows tab in a metric’s Query Metric Configuration
Save
Exception Records
Exception reports
Notifications
Exception Dashboard
Escalation
Escalation uses a member reporting hierarchy so exception records reach the right people.- Reports To: Each member has a Reports To manager, set in Access → Member. The Member hierarchy view (the second icon at the top right of the Access page) shows the tree with each member’s role and number of direct reports, and a search box to find a member.
- Role display names and owner mapping: In Access → Role, each role has a Display name and a Show in owner mapping switch (off by default). When it is on, the display name appears as a row on the asset’s Owners panel, and the user picker for that row lists only members who hold the role.
- Owner filter: The Exception dashboard in Analytics has a Member filter that shows the hierarchy, so you can view exceptions for a member or their reporting team. Exceptions without an owner appear under Unassigned.
- Notifications: Notifications are sent when an owner or status changes. See Exception notifications.
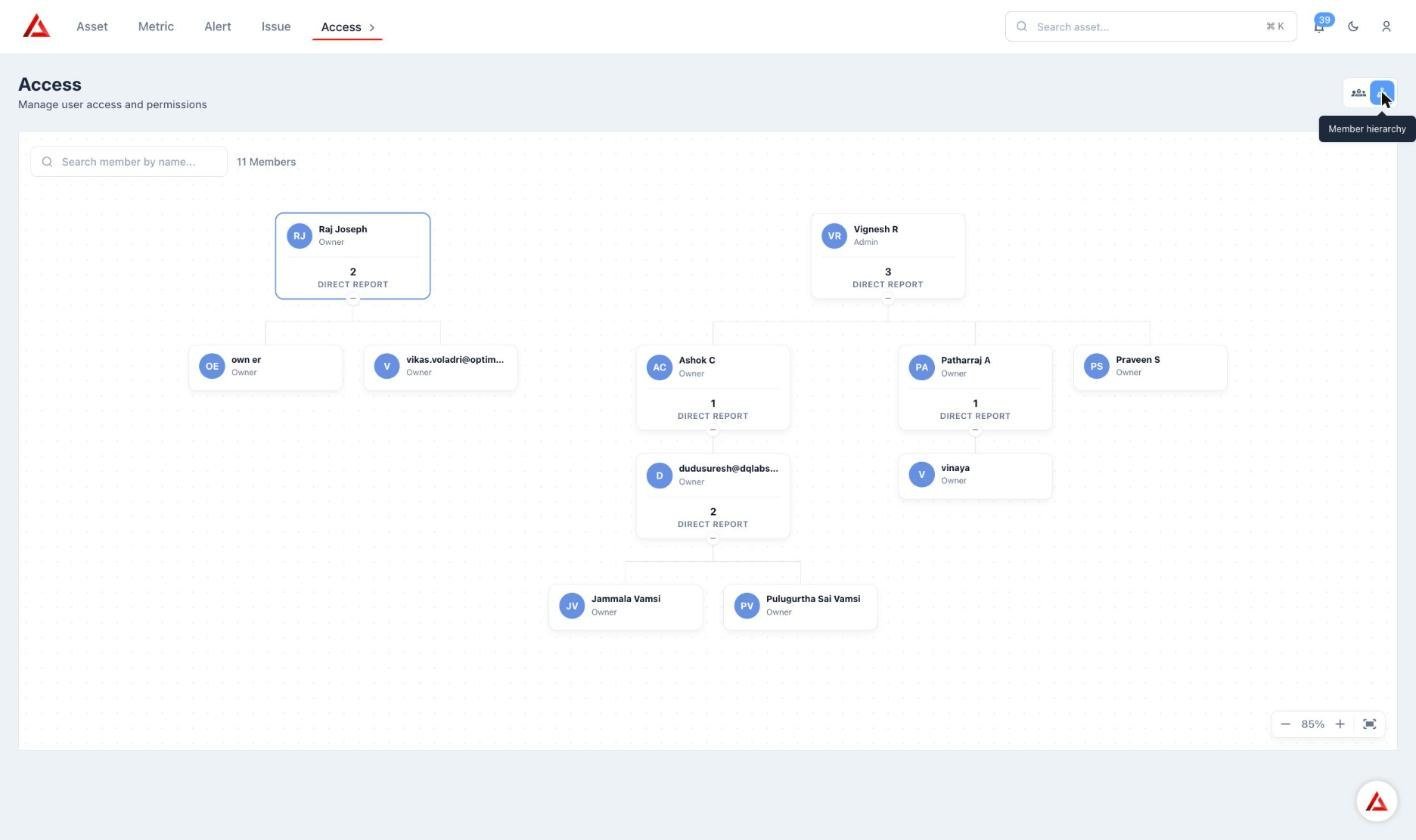
Member hierarchy in Access
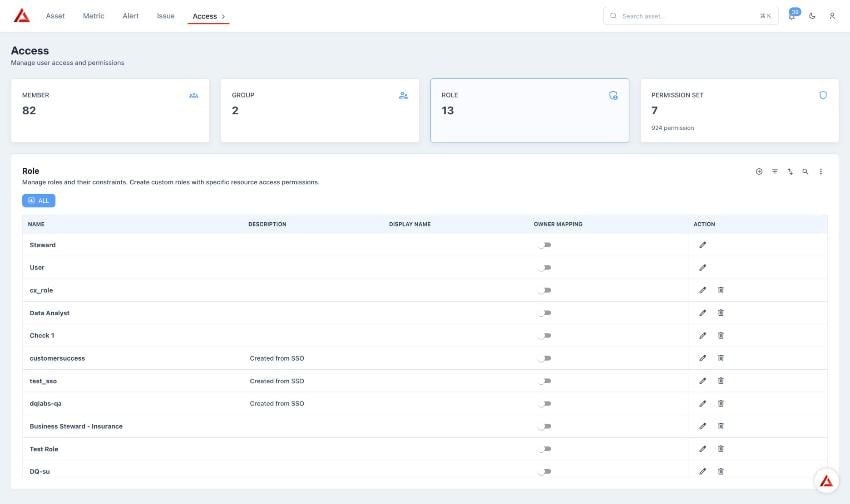
Role display name and owner mapping in Access → Role
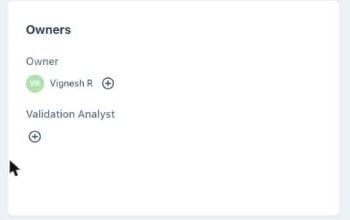
A role display name shown on the asset Owners panel
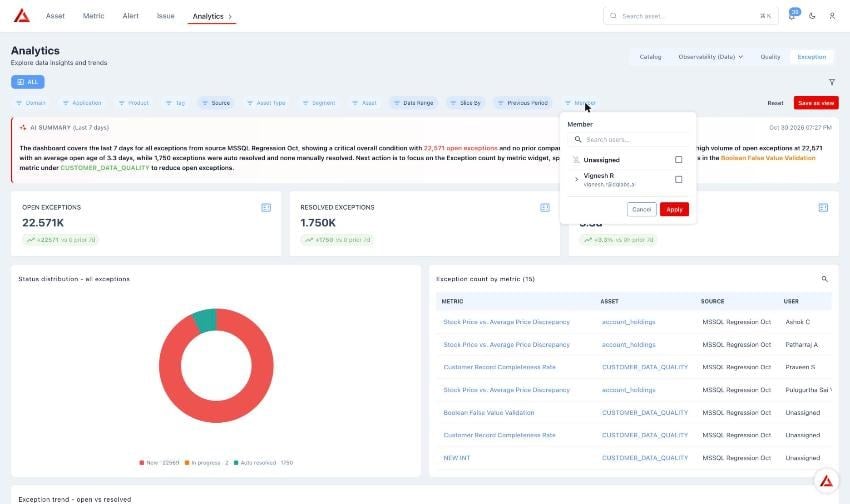
Member filter on the Exception dashboard
Comparison and distribution report templates
Exception reports support three report types. Open Exception → Reports, select a report, and choose the type in the Type list on the Configuration tab:- Exception (Default): the standard exception report.
- Distribution: a distribution table of exceptions. The table uses Metric Criteria in place of the former rule column. Columns appear in this order: Critical, High, Medium, Low, followed by Critical %, High %, Medium %, and Low %.
- Comparison: a comparison-style report for exception results.
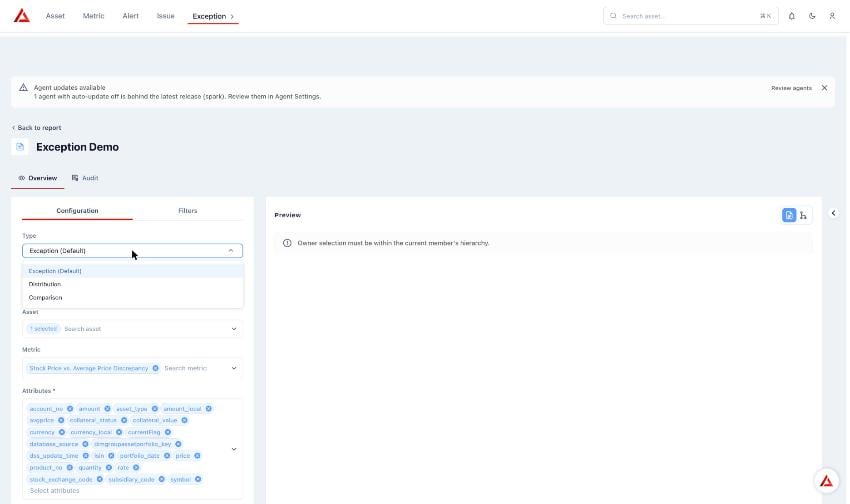
Report type list in the exception report editor